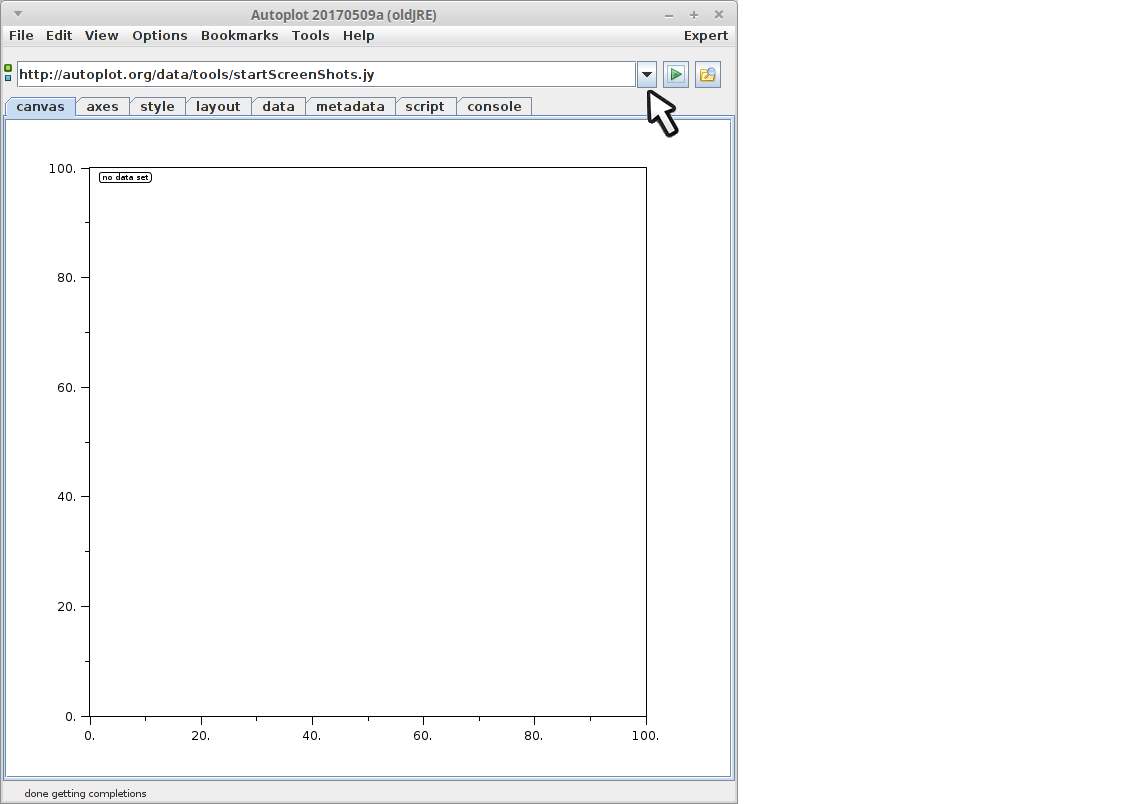
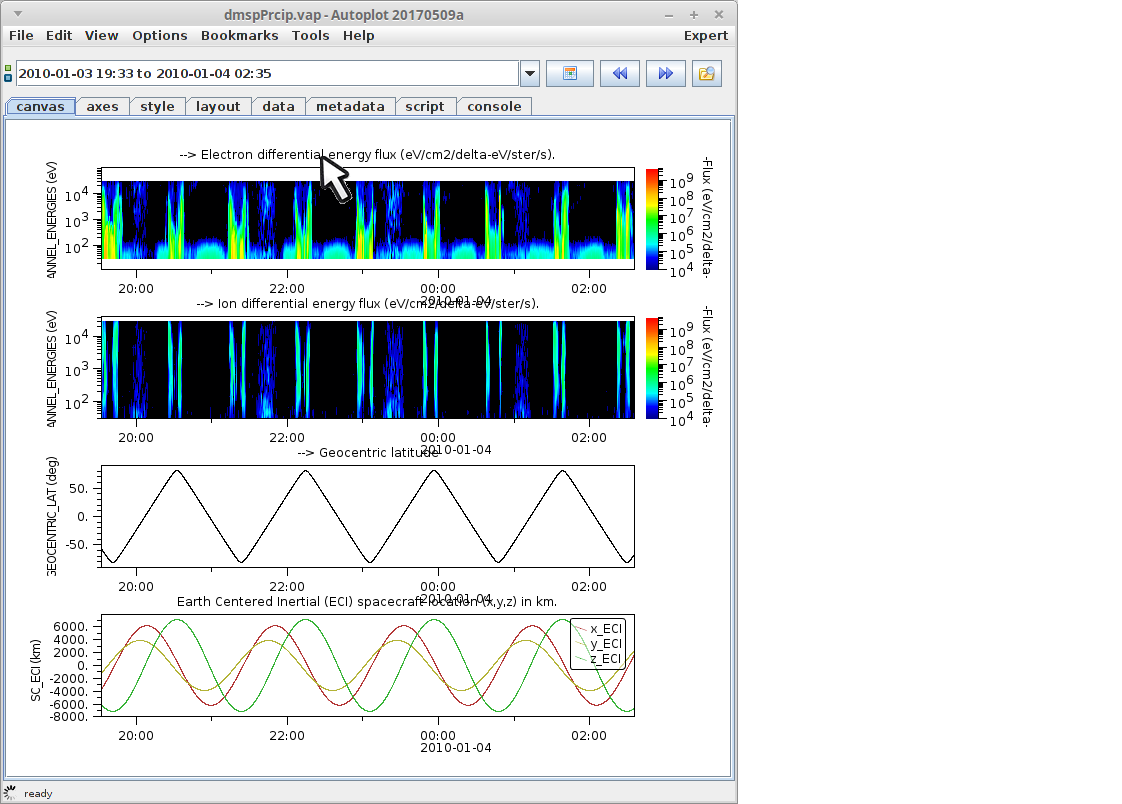
Start Autoplot
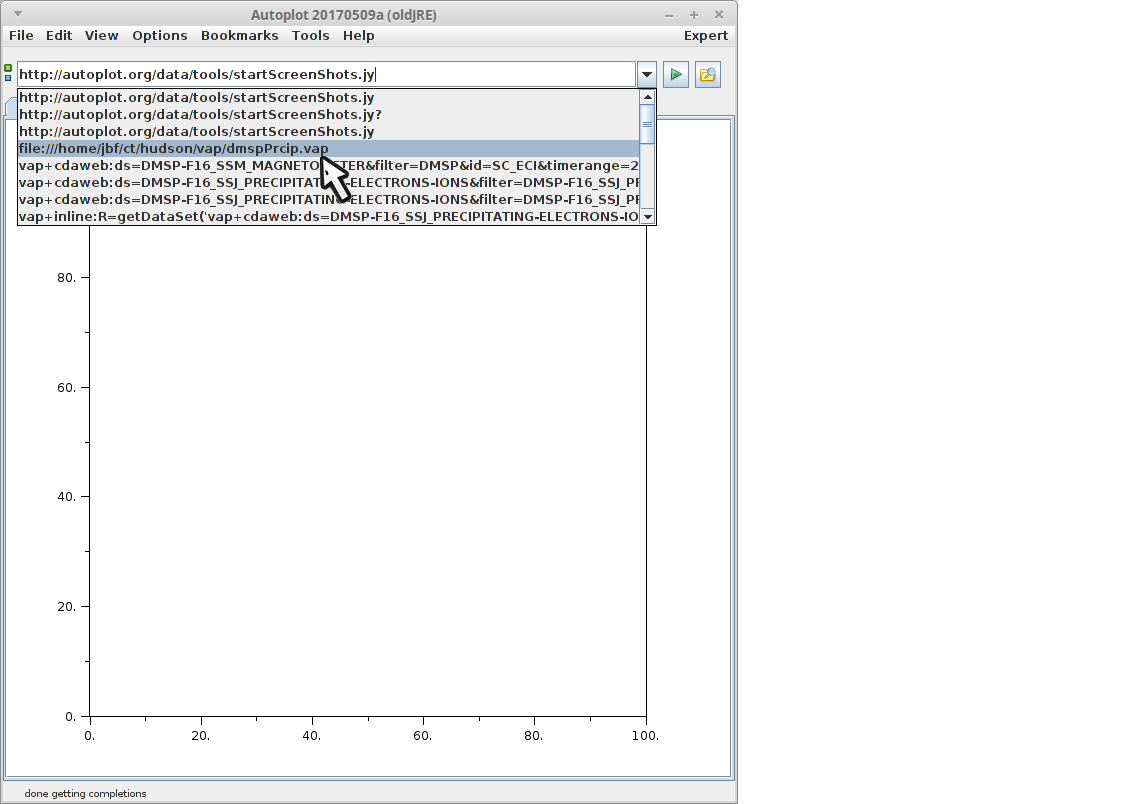
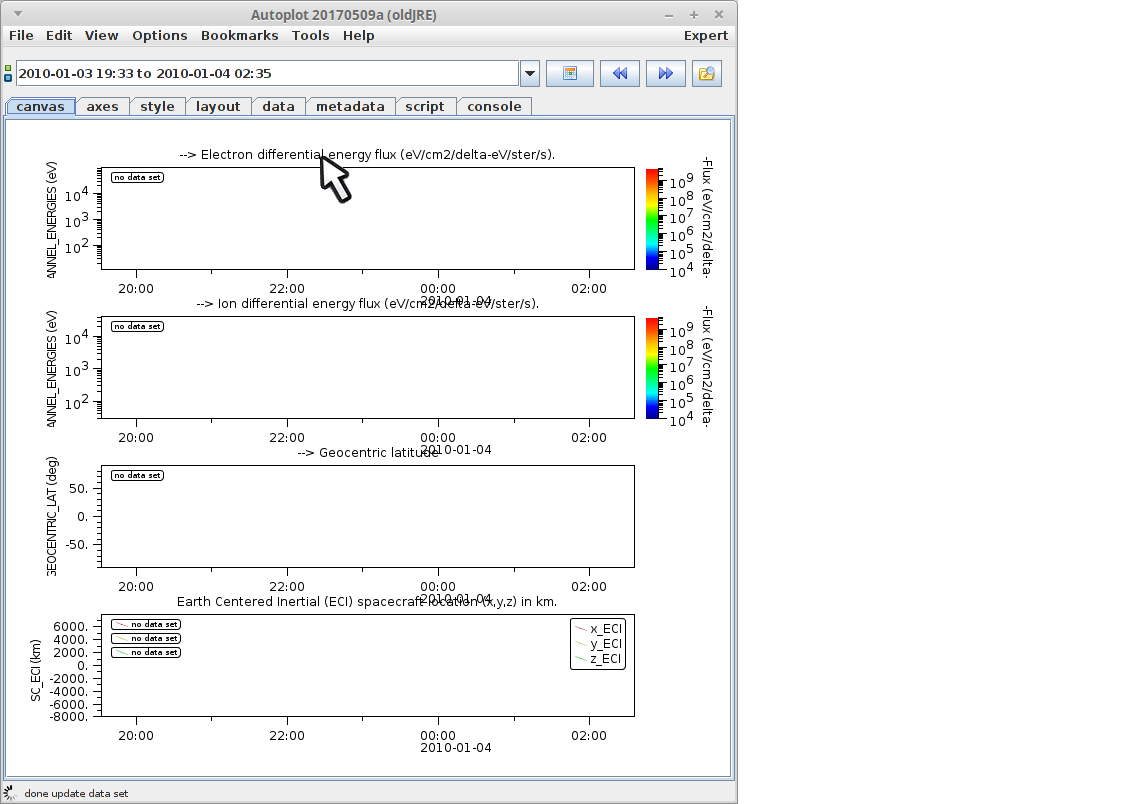
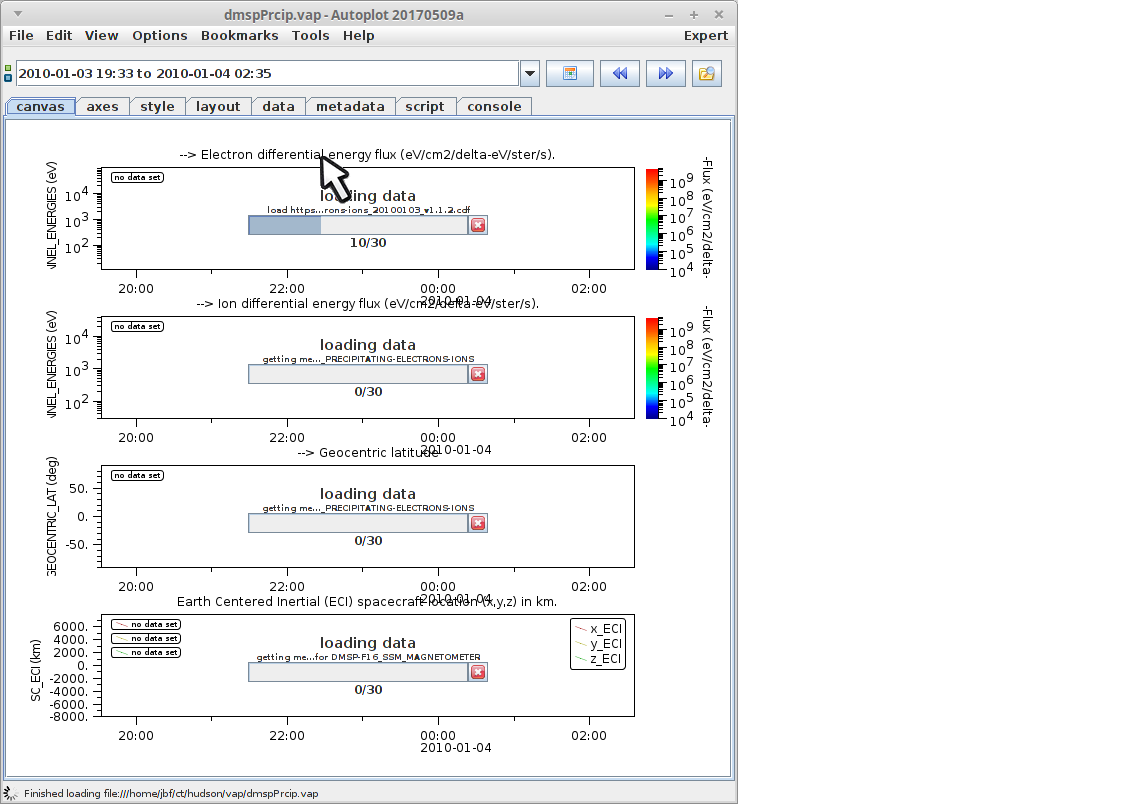
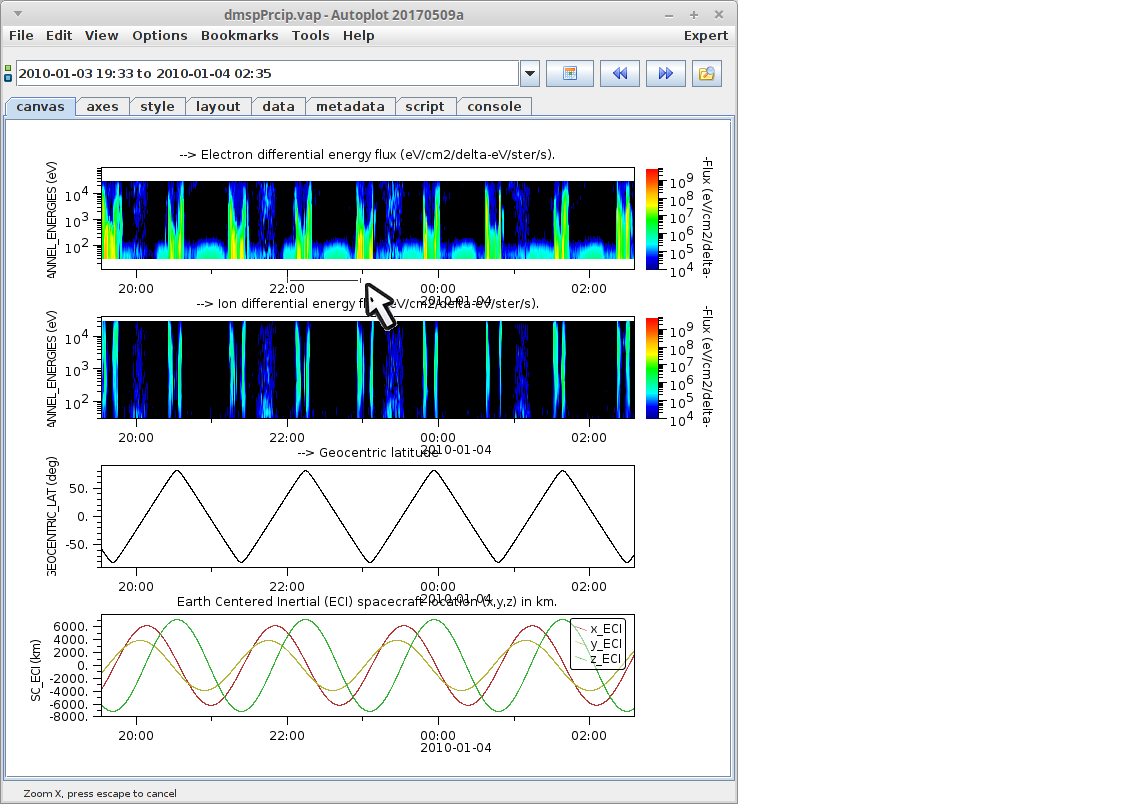
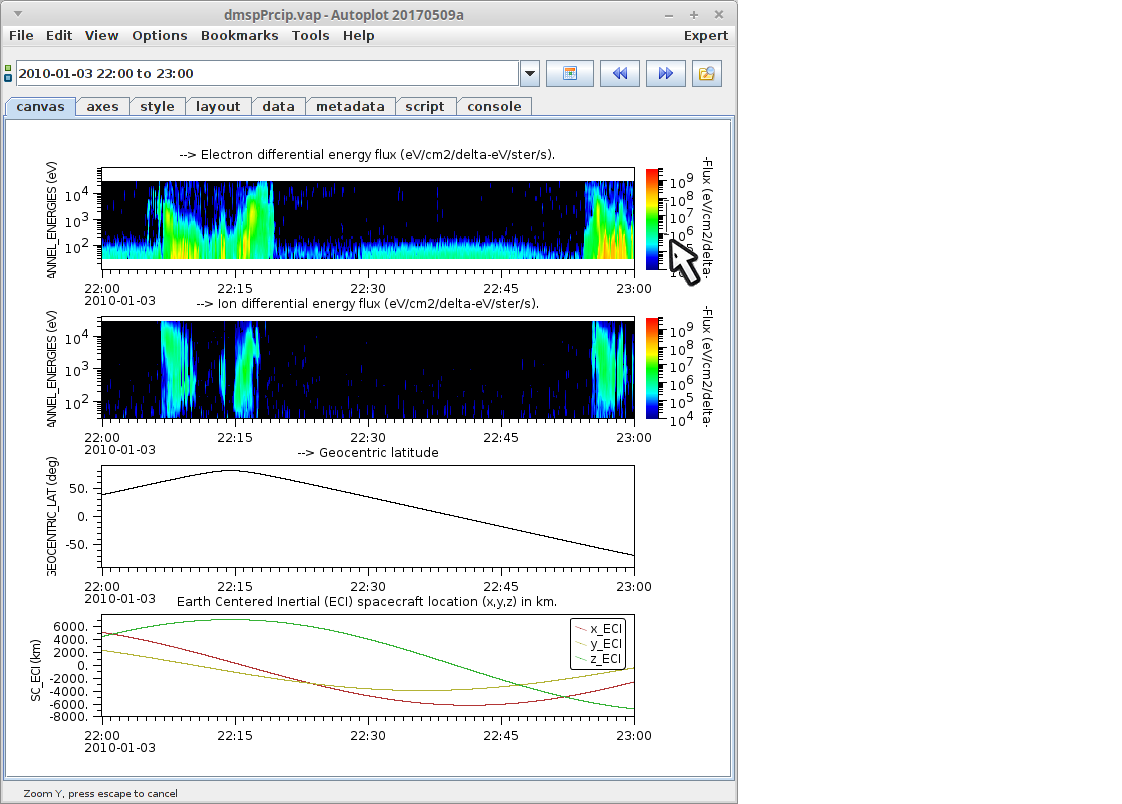
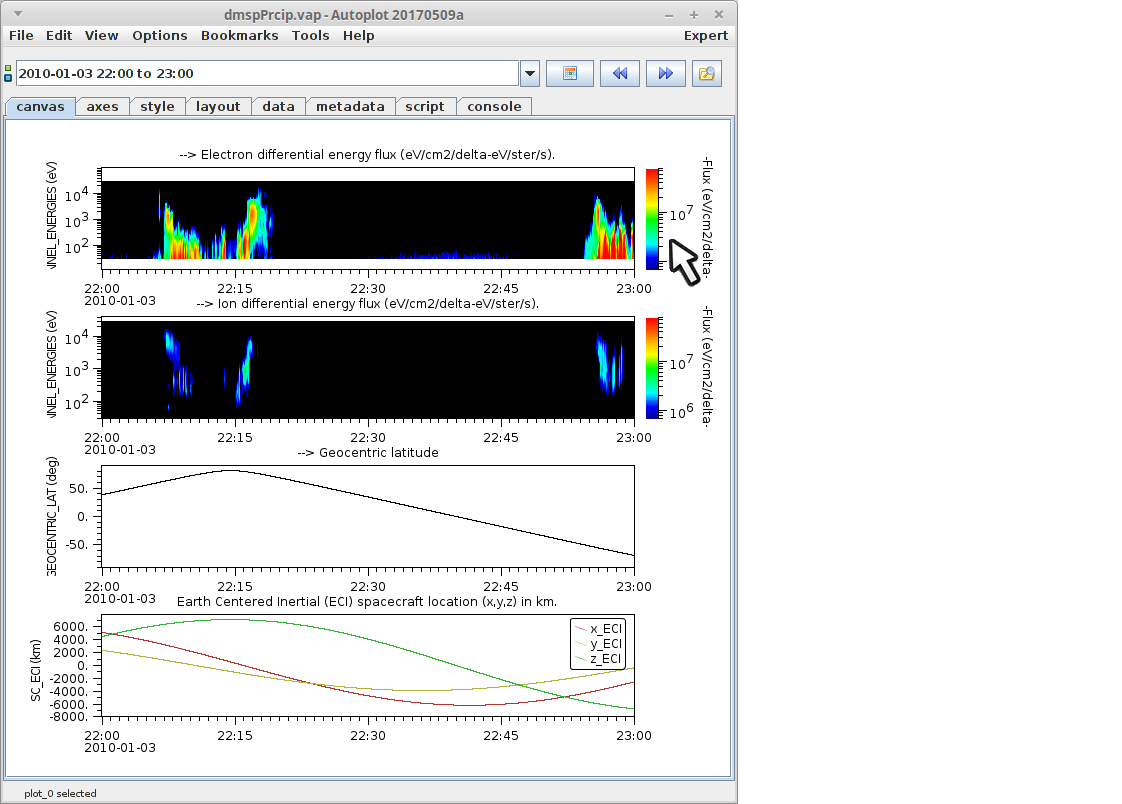
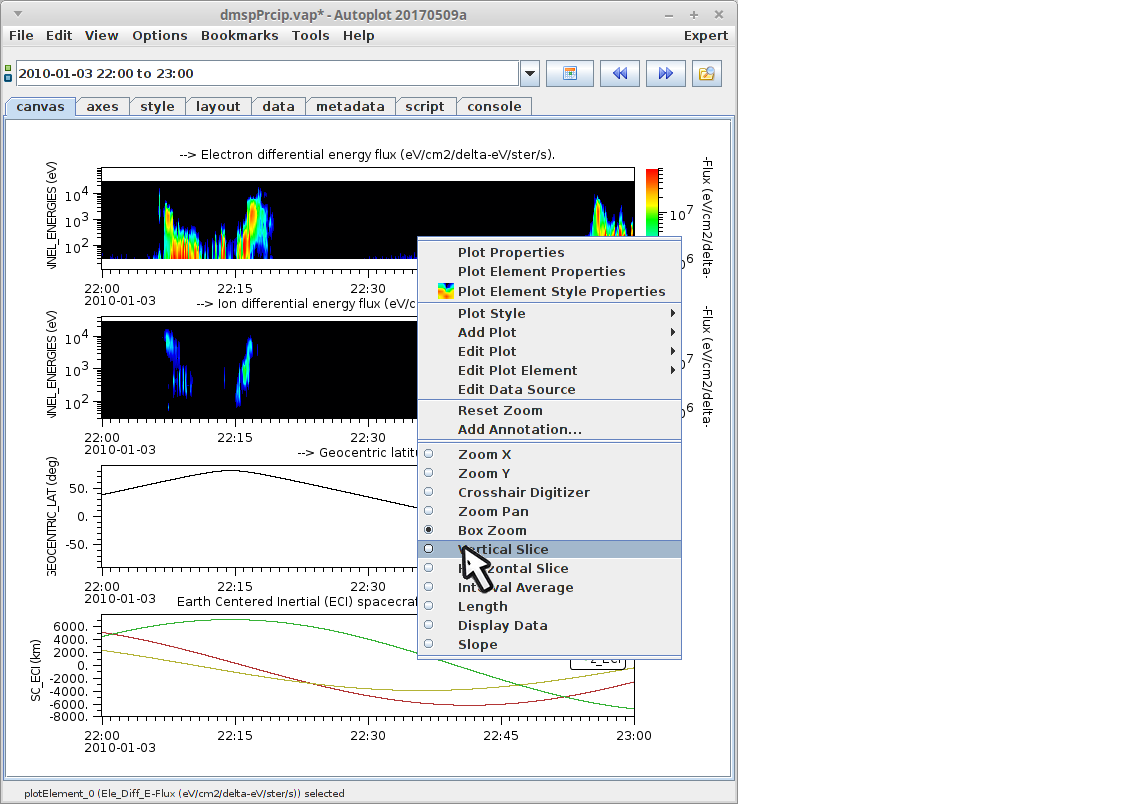
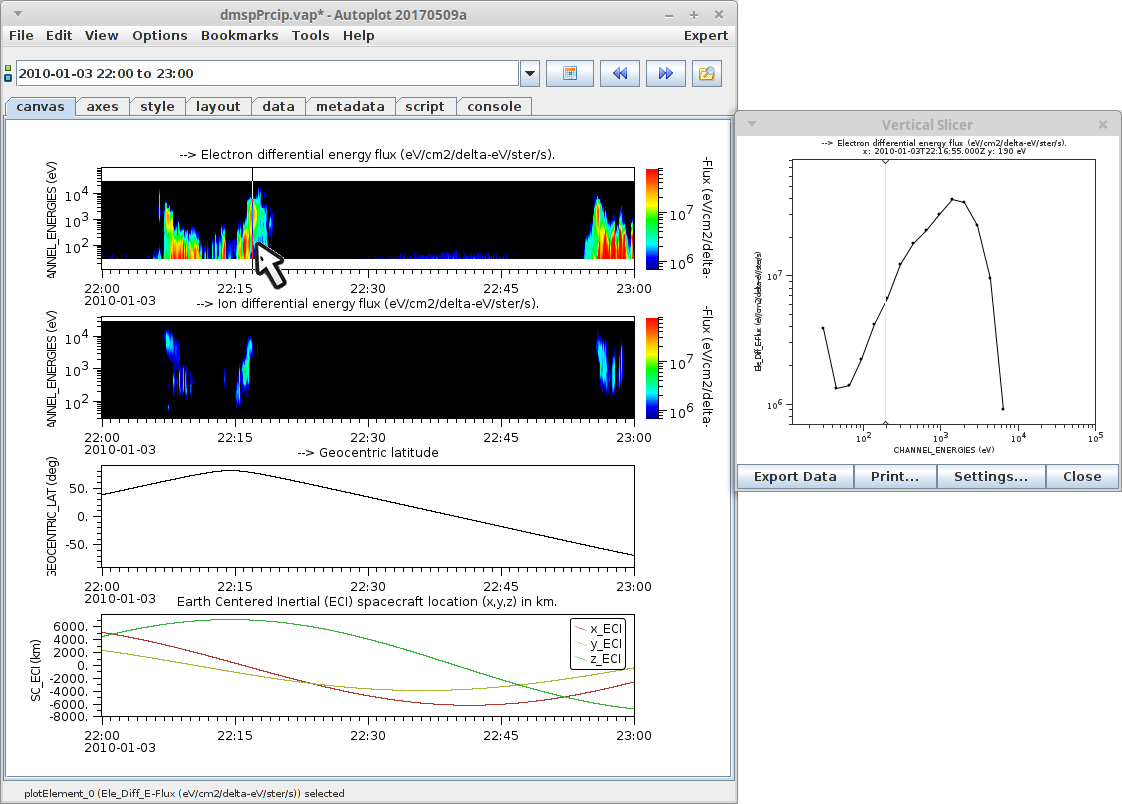
Select a .vap product file, which contains the plot layout.Vap is loaded, laying out the plots and data loading begins.Data loading...Data is loaded within moments.Click and drag on x-axis to zoom in.Zoom on Z to adjust the colorbar range.Note the two colorbars are "bound together" and will have the same settings. This is configured in the .vap file.Right-click to enter popup plot context menu.Switch to the Vertical Slice.Click on the plot to look at slices.