script.cookbook
From autoplot.org
Contents |
1. Scripts with Callbacks
Some scripts have "callbacks" where Autoplot calls the script to respond to human-operator events or other actions.
1.1. Single-Point Digitizer
We want to digitize X,Y points from a data plot. Perhaps this is a spectrogram with a cutoff, or the top of a peak. We need to make a call-back which will receive the data points from the Das2 library.
# title: Add Point Digitizer
# label: Point Digitizer
# Click events are registered on the tab "digitizer." If the data is a spectrogram,
# report the Z value as well.  Note this will not work with the pitch angle distribution.
# This also provides feedback showing the digitized data and the data points selected in the
# digitizer tab.

typ= getParam( 'typ', 'Click', 'Digitizer Type', ['Click','Key'] )

from org.das2.components import DataPointRecorder
from org.virbo.dataset import SemanticOps
from org.das2.dataset import DataSetUpdateListener
from org.das2.graph import SpectrogramRenderer
import java.util.HashMap

if ( len(dom.plotElements)<3 ):
    uri= dom.dataSourceFilters[0].uri
    setLayoutOverplot(3)
    plot(0,uri)

dpr= DataPointRecorder()

addTab( 'digitizer', dpr )

class MyUpdateListener( DataSetUpdateListener ):
   def dataSetUpdated( self, e ):
       ds= dpr.getDataPoints()
       print ds
       if ( ds!=None ):
           plot( 2, ds[:,0], ds[:,1], color=Color.GRAY, symbolSize=8, lineStyle='none' )
       else:
           plot( 2, "" )

dpr.addDataSetUpdateListener( MyUpdateListener() )

class MySelectionListener(DataSetUpdateListener):
  def dataSetUpdated(self,event):
       ds= dpr.getSelectedDataPoints()
       if ( ds!=None ):
           plot( 1, ds[:,0], ds[:,1], color=Color.YELLOW, symbolSize=11, lineStyle='none' )
       else:
           plot( 1, ""  )

dpr.addSelectedDataSetUpdateListener( MySelectionListener() )

pp= dom.plots[0].controller.dasPlot

from org.das2.event import DataPointSelectorMouseModule
from org.das2.event import CrossHairRenderer

dprr= CrossHairRenderer( pp,None,pp.getXAxis(),pp.getYAxis() )
mm= DataPointSelectorMouseModule( pp, None, dprr, 'digitizer' )

if ( typ=='Key' ):
   mm.setReleaseEvents(False)
   mm.setKeyEvents(True)
   mm.setDragEvents(False)
else:
   mm.setReleaseEvents(True)
   mm.setKeyEvents(False)
   mm.setDragEvents(False)

def dataPointSelected(event):
   x= event.getX()
   y= event.getY()
   if ( typ=='Key' ):
       map= java.util.HashMap()
       map['key']= event.getPlane('keyChar')
       dpr.addDataPoint( x, y, map )
   else:
       dpr.addDataPoint( x, y )
   pes= dom.controller.getPlotElementsFor(dom.plots[0])
   if ( len(pes)==0 ):
       setStatus('no data found for plot')
       return
   ds= pes[0].controller.getDataSet()
   if ( ds==None ):
       setStatus('nothing plotted')
       return

mm.dataPointSelected=dataPointSelected

pp.dasMouseInputAdapter.primaryModule= mm

# make sure the focus is on the 0th plot element.  The 2nd will be the selected points and above that is the digitized.
dom.controller.plotElement= dom.plotElements[0]

import javax.swing.JOptionPane
if ( typ=='Key' ):
   javax.swing.JOptionPane.showMessageDialog( getViewWindow(),'Click on the plot and press a key, and it will be recorded on the digitizer tab')
else:
   javax.swing.JOptionPane.showMessageDialog( getViewWindow(),'Click on the plot, and it will be recorded on the digitizer tab')

dom.plots[0].yaxis.autoRange= False
1.2. Property Change Listener
You can register actions when properties change. For example, suppose you want to run an analysis the the visible time range. You can add a property change listener which takes action each time.
from java.beans import PropertyChangeListener

class MyPCL( PropertyChangeListener ):
    def propertyChange( self, e ):
        print e

dom.plots[0].xaxis.addPropertyChangeListener(MyPCL())
Note Jython allows you to state this more succinctly:
def axisChange( e ):
    print e

dom.plots[0].yaxis.propertyChange= axisChange
Now let's do something with the property:
def axisChange( e ):
    if ( e.propertyName=='range' ):
        print '%s -> %s' % ( e.oldValue, e.newValue )

dom.plots[0].yaxis.propertyChange= axisChange
Here's a function which adds a callback when a property changes, culling rapidly occurring events:
def addPropertyChangeListener( bean, prop, callback ):
   'add a property change listener to the bean'
   from java.beans import PropertyChangeListener
   from org.autoplot.util import TickleTimer
   class TTPCL( PropertyChangeListener ):
      def propertyChange(self,evt):
          print 'tt propertyChange'
          invokeLater( callback )
   tt= TickleTimer(250,TTPCL())
   class MyPCL( PropertyChangeListener ):
      def propertyChange(self,evt):
          print 'propertyChange'
          tt.tickle()
   bean.addPropertyChangeListener( prop, MyPCL() )
So with one line we can add a listener:
def update():
    print 'it changed'
addPropertyChangeListener( dom.plots[0].xaxis, 'range', update )
1.3. Custom Renderer
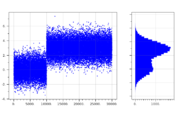
Autoplot v2017a_6 makes it easy to add custom renderers, which convert data into pixels, in scripts.
from org.das2.graph import Renderer
from java.awt.geom import GeneralPath

class HistogramRenderer( Renderer ):
   def doAutorange( self, ds ):
       xr= extent( ds )
       yr= extent( ds.property( QDataSet.DEPEND_0 ) )
       bds= join(rescaleRange(xr,-0.1,1.1),rescaleRange(yr,-0.1,1.1))
       return bds

   def render( self, g, xaxis, yaxis, monitor ):
       xzero= xaxis.transform(0,xaxis.getUnits())
       ds= self.getDataSet()
       if ( ds==None ): return
       yds= ds.property(QDataSet.DEPEND_0)
       ddy= float( ( yds[1]-yds[0] ) / 2 )
       cc= self.getColorControl('color',Color.BLUE)
       gp= GeneralPath()
       yd= yaxis.transform(yds[0]-ddy,yaxis.getUnits())
       gp.moveTo( xzero, yd )
       for i in range(ds.length()):
           y= yds.value(i)
           x= ds.value(i)
           xd= xaxis.transform(x,xaxis.getUnits())
           yd= yaxis.transform(y,yaxis.getUnits())
           yd0= yaxis.transform(y-ddy,yaxis.getUnits())
           yd1= yaxis.transform(y+ddy,yaxis.getUnits())
           gp.lineTo( xd, yd0 )
           gp.lineTo( xd, yd1 )
       gp.lineTo( xzero, yd1 )
       g.setColor( cc )
       g.fill( gp )

# demo code below shows its use.
reset()
ds= append( randomn(5334,10000) , 3+randomn(5335,20000) )
setCanvasSize(724,460)
plot( ds, xpos='3em,70%-3em', ypos='50px,400px', color=Color.BLUE, renderType='scatter', symbolSize=3 )

plot( 1, histogram(ds,50), xpos='70%+2em,100%-2em',  ypos='50px,400px', color=Color.BLUE,
      ydrawTickLabels=False, renderer= HistogramRenderer() )
1.4. Add Buttons To PngWalkTool
We wanted a faster way to create "QC" (Quality Control) Records, which tag images as okay or problem. Normally this would take several mouse clicks per image, so we wanted a faster way to go through the set. This adds buttons which are short-cuts to the QC buttons.
pngs = getParam('pngDir', 'file:///home/jbf/pngwalk/voyager1/*.png', 'directory to examine')

from org.autoplot.pngwalk import PngWalkTool
p= PngWalkTool.start(pngs, getViewWindow())

# may need, depending on if QC has already been started...
if not p.isQualityControlEnabled(): p.startQC()

from javax.swing import JLabel, JPanel, JButton, ImageIcon
from java.awt import FlowLayout
from org.autoplot.pngwalk import PngWalkView,QualityControlRecord

def greenAction(evt):
    p.setQCStatus( "",QualityControlRecord.Status.OK );
    p.sequence.next()
def greyAction(evt):
    p.setQCStatus( "",QualityControlRecord.Status.IGNORE );
    p.sequence.next()
def redAction(evt):
    p.setQCStatus( "",QualityControlRecord.Status.PROBLEM );
    p.sequence.next()

mytl= JPanel()
mytl.setLayout( FlowLayout( FlowLayout.LEFT ) )
mytl.add( JButton( ImageIcon(PngWalkView.getResource("/resources/badge_ok.png")),actionPerformed=greenAction ) )
mytl.add( JButton( ImageIcon(PngWalkView.getResource("/resources/badge_ignore.png")), actionPerformed=greyAction ) )
mytl.add( JButton( ImageIcon(PngWalkView.getResource("/resources/badge_problem.png")), actionPerformed=redAction ) )

p.addActionComponent( mytl, None )
2. Scripts
2.1. Setting the color of each plot symbol
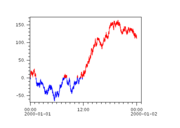
Suppose you have scatter data which you want to encode with colors. There are a couple of ways you can do this. The simplest is when there are just a couple of colors, and you can have two calls with an overplot.
reset()  # reset to one empty plot
y= accum( randomn( 5334,10000 ) )  # 5334 is a random seed
t= linspace('2000-01-01T00:00','2000-01-02T00:00',10000)
r= where( y.ge(0.) )
plot( 0, t[r], y[r], color='red' )
r= where( y.lt(0.) )
plot( addPlotElement(0), t[r], y[r], color='blue' )
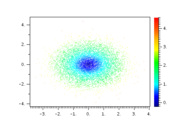
Sometimes you want to color-code by another dataset, using a colorbar to transform from Z value to color. The "color scatter" mode does this:
reset()  # reset to one empty plot
x= randomn( 5334, 10000 )
y= randomn( 5335, 10000 )
z= sqrt( x**2 + y**2 )
plot( x, y, z )
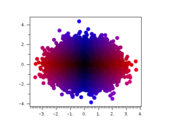
Last, you can use a kludge, where if the z data has units Units.rgbColor then the Z value specifies the color directly.
reset()  # reset to one empty plot
x= randomn( 5334, 10000 )
y= randomn( 5335, 10000 )
red= floor( lesserOf( abs( x ) / 4 * 256, 255 ) )
blue= floor( lesserOf( abs( y ) / 4 * 256, 255 ) )
rgb= rgbColorDataset( red, dataset(0), blue )
plot( x, y, rgb, symbolSize=10 )
dom.plots[0].zaxis.visible= False  # the Z axis needs to be disabled manually.
2.2. Histograms and Stats
There are a number of routines which perform statistics and other reduction on data. For example, the histogram does a histogram of the data:
ds= randn(200000)
h= histogram(ds,40)
plot(h)
You can more precisely specify the bins with:
ds= randn(200000)
h= histogram(ds,'-10','10','0.1')
plot(h)
These are in quotes because you might have datums like "-10cc" or "2017-001".
2.3. Importing New Libraries like Apache Math
I needed the Bessel function to support a SciPy implementation of Geopack. I can import it using the addToSearchPath command, which can download and mount a jar.
import sys
addToSearchPath(sys.path,'http://www.trieuvan.com/apache//commons/math/binaries/commons-math3-3.6.1-bin.zip/commons-math3-3.6.1/commons-math3-3.6.1.jar', monitor )

from org.apache.commons.math3.special import BesselJ

print BesselJ(1).value(1.0)  # This should be the same as special.J1(1.0)
print BesselJ(1).value(2.0)  # This should be the same as special.J1(2.0)
print BesselJ(0).value(1.0)  # This should be the same as special.J0(1.0)
print BesselJ(0).value(2.0)  # This should be the same as special.J0(2.0)


