Autoplot Application (20180407a)

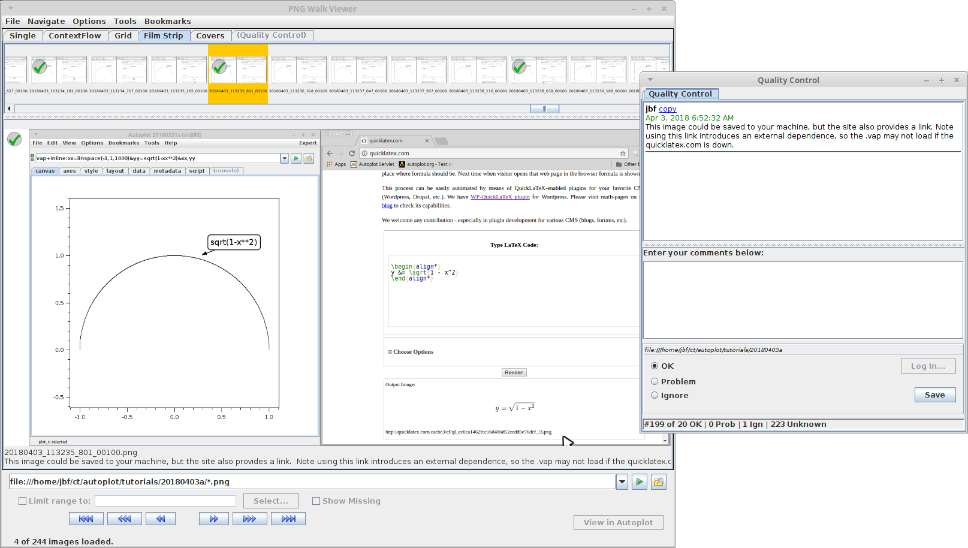
PNGWalk is used select frames and write captions for a tutorial. The tutorial shows how to use LaTeX in annotations and is available here
Autoplot attempts to allow plotting of data from many data sources, including remote CDF files and OpenDAP servers.
Datasets are identified with URIs, and by the URI's extension, data are loaded into the internal data model. Data are then
displayed by guessing the rendering method and axis ranges to provide a reasonable, useful view of the data. Data can then
be additionally processed with other operations like smooth and FFT, and Jython scripting provides a capable programming environment.
This is the Autoplot2017a branch. This is an update to the production version containing bugfixes and minor new features.
Java 7 is now required. Java 8 will be required sometime soon.
Single-jar version, autoplot.jar, can be run without network access and from the command line.
Mac DMG Release is available.
Bugfixes (2018-04-07 r22284):
- 1672: annotations were triggering a repaint, so it was repainting continuously.
- formatDataSet command checks for prefix so that the extension can be different than the format.
- yaxis switch mishandled in image data source, units can now be non-dimensionless. Thanks, Chris!
- 1975: route to generate hang in export for new users because "/..." was default filename, not "file:/..." Thanks, Chris!
- more tweaks to the Mashup tool where drag source is considered when replacing child node.
- bugfix with completions, RTE when tot=nn[0]*nn[1] was used and nn not properly culled.
- 1956: limit off-screen drawing of event bars, which can result in PDFs which don't import well into MS Word. Thanks, Bill!
- "now" supported in low-level parse time. Before only application-level parsers would handle this.
- Annotation has URL property, to avoid text="http://..." kludge and allow text to be used to document web address.
- FileUtil.fileCopy of A to A would destroy the contents of A!
- PNGWalkTool's make HTML would fail miserably when the result was written to the same folder as the pngwalk.
- 1973: experiment with clearing the focus URI when script or .vap is run.
- 1972: "reset" method cancels all the tasks it knows about.
- mashup starts with "ds" for the first tree, so that is valid.
Older Bugfixes:
- JNLP template supports builds on new machines.
- Overzealous check for valid y tags prevented use of MAGEIS data from script.
- rte_1235389582: failed listing in Aggregation GUI caused runtime error.
- setDepend1Cadence filter is properly handled and has a GUI.
- Experimental HAPI caching does not cache after modified date.
- AggregratingDataSource had code branches which misused progress monitors, causing warning message on stderr.
- Mashup was checking for TimeSeriesBrowse, which can rely on web transactions, on the event thread, causing hangs with slow websites.
- pngwalk of file:///home/jbf/ictemp/2018/*/*/ic_*_12.jpg (star multiple levels deep) showed a bug where the filenames were incorrectly handled, resulting in runtime error in Autoplot's pngwalk.
- 1899: don't display a warning about units if yaxis units are dimensionless.
- QStream and Das2Stream export split into separate codes. Thanks, Chris!
- 1969: MutablePropertyDataSet no longer implies mutable. Thanks, Jon N.!
- Chris put in support for the Das2Server to support redirects from http to https.
- write animated gif delay times corrected, where delays were 1/10 of what they should have been.
- jython completions will evaluate constructors. be more aggressive about dropping trailing lines to make a valid code.
- slice editor will look up the index as the time is changed.
- corrections to mash-up tool, preserving unfolded tree states and where function name was mistaken for variable name.
- 1956: horizontal lines were not drawn because bounding box had height=0. Vertical lines had the same problem.
- 1966: runScript which should be called from the event thread, loads the script off the event thread.
- 1600: in history.txt, only log URIs which are human-entered.
- rte_1731551069: filtering with "where" in CDF files, when data has different rank.
- 1965: "and" and "or" need to be infix operators in mashup. Thanks, Allison!
- 1963: Ivar caught where a loop didn't check the dirty flag to see if a script needed to be saved.
- popup documentation for annotation and plot now have link to wiki. Thanks, Ivar!
- two-argument properly accum checks units now.
- Correct histogram mode when data x units are different than axis units.
- dasCore didn't support axis labels on top.
- 1408: experiment with leaving the script name onto the address bar by replacing it when the progress bar finishes.
- HAPI html redirects didn't have timeout. (Some normal connections too.)
- improve jython completions support by testing for second line with indent continuation.
- jython editor has new "run selected" action.
- fix runtime error which could happen when %d was the format. Some codes didn't check for this and cast the data.
- 1947: fix 1-pixel error in colorbar pointed out by Kristoff. (Now it's a half-pixel, but this is a PDF rendering problem.)
- always get the makeTutorialHtml from the website, since release showed there were issues.
- 1962: catch strange ConcurrentModificationException when running http://autoplot.org/data/script/examples/plotsAndAnnos2018.jy
- dataset toString method had a branch which would cause RTE when format was %d (integer).
- clean up of synchronize function, recent changes could cause index-out-of-bounds error.
- 1687: various improvements and clean-up of Jython completions engine.
- rte 0413258104: format timetags of Units.cdfTT2000 was mis-handled for SCALEMIN and SCALEMAX properties.
- rte553: property assign units for ds[0,:]=ds1 and ds1 has units and ds does not.
- print a warning when a FloatDataSet is used to store time location data, since this is rarely going to work.
- 1959: fix layout doesn't swap plot positions when rows are out-of-order (item 4).
- 1956: FCE line which was way off-canvas still affected PDF output, messing up the bounding box. Thanks, Bill!
- 1957: correct where set depend0 cadence would reset improperly to picoseconds. Thanks, Bill!
- 1958: NetCDF library didn't properly handle spaces in filenames. Thanks, Masafumi!
- 1953: Masafumi found cases where rounding was done incorrectly, probably because kludgy code was removed. Thanks, Masafumi!
- Autoplot server (port 12345) improperly created the Jython environment, breaking plot named parameters. Thanks, Eric!
- 1952: uncommitted changes implementing flag for indexed properties and allowing just AbstractDataSet to handle properties.
- rte_1463914178: throw a more descriptive error do we can figure out what's going on.
- 1953: kludgy code resulted in errors with some CDF_TT2000 times, showing 23:61 instead of 00:01 under some conditions. Thanks, Ivar!
- 1952: reimplement isInheritedProperty to avoid so much string searching with slice operations.
- extent code used isMonotonicAndIncreasingQuick, when new isMonotonicQuick is sufficient. Thanks, Ivar!
- 1952: rewrite within(), used in huge scatter, to dramatically improve performance. Thanks, Ivar!
- 1952: "where" uses bigger blocksize for 5000000 record operation, showing modest (20-30%) speed improvements. Thanks, Ivar!
- direct access of longs from CDF file was never verified, now it's correct.
- rte_0609678840: old icon reference in jnlp single-instance code corrected. Thanks daekyu!
- 1952: Ivar had a code which showed where a check for each of 5000000 points' properties was slowing things down, this test is limited to QDataSet.MAX_PLANE_COUNT (=50) now..
- 1748: insert PWD before completions. Thanks, Masafumi!
- minor improvements to the contours renderer. Thanks, Masafumi!
Features:
- Series rendering mode supports fill below reference and fill above reference. Thanks, Kris and Ivar!
- rfe629: experiments with nominal level and warning level lines in series renderer. Thanks, Jon N!
- expendWaveform filter added, to aid in browsing waveform data with low duty cycles. Thanks, George!
- rfe515: new makeColorTable command, for use with plot command. Thanks, Masafumi!
- draw the last QC message below the full-sized image.
- New url property of Annotation clarifies use, and allows URL to cache image of LaTeX-rendering site, and LaTeX code can be stored in the text for safe-keeping.
- HAPI client will use "If-Modified-Since" request header and supports 304 (not modified) responses, when caching is enabled.
- audiosystem data source allows control of sampling rate.
- add "bind scale to opposite axis." Isotropic should no longer be used.
- add "normalize" function. Thanks, Allison!
- add inverse_white_blue_black. Thanks, Masafumi!
- DasAxis now has "reference" property which will draw a line at the reference. Thanks, Kris and Ivar!
- add two more symbol connection styles, requested by Ivar.
- allow "45 Deg F" + 2 = "47 Deg F"
- mashup tool shows jython code for collapsed nodes.
- Autoplot servlet supports HAPI data sources.
- inverse white-blue-black colorbar added. Thanks, Masafumi!
Less recent features:
- 626: ctrl+shift+play (and shift+"plot below") is plot above.
- if the fill-to-reference color is transparent, then draw a line the color of the axes at the reference value.
- URI history now only records human-entered URIs, so URIs loaded within vap do not clutter history.
- 584: addToSearchPath supports single-jar releases.
- mashup tool guesses names for variables.
- jython script plot command has topAxisOf keyword which makes a new plot with the axis drawn on top.
- improve error message when ISO8601 time is sent to DatumRangeUtil.parseTimeRange (not parseTime).
- add tickSpacing property to orbit control GUI.
- console "AP>" prompt tooltip shows the stack trace at the last highlighted message.
- indgen returns an IndexDataSet that takes no memory and is well-suited for Jython scripts.
- Orbit plot allows the tick frequency to be controlled. Thanks, Bill!
- Property editor now allows "edit selected" on root of array. Thanks, Jeremy!
- Jython gets new "dataset" command which takes properties as named parameters.
- annotation command allows "OutsideSE", and corrects offset for OutsideNE. Thanks, Ivar!
- annotation command allows "" for rowId and columnId, which anchors to the canvas boundaries.
- Improve create-pngwalk feedback with $Y$j_$H$M$S(subsec,places=3), and include $H$M$S$(subsec,places=3) in examples.
- AutoplotDataServer supports HAPI by generating info and data responses. Thanks, Bob!
- tune huge scatter for when data units are the same as axis units.
- FDataSet can provide access to raw float values, avoiding numerical noise from float-to-double casting, using new capability.
- several rebin functions renamed to binAverage, since they are unlike the IDL routines and the name causes confusion. Thanks, Masafumi!
- new annotation command is easier to use than previous calls to create annotations from scripts. Thanks, Masafumi!
- Contours renderer has more controls now. LabelCadence is now a string to support "20em". Thanks, Masafumi!
Known issues:
- see Source Forge
- Bugs often have a four-digit ID and can be reviewed with https://sourceforge.net/p/autoplot/bugs/<ID>/.
- Features typically have a three-digit ID and can be reviewed with https://sourceforge.net/p/autoplot/feature-requests/<ID>/.
This completes the feature set for the new production branch. No major features will be added before branching this version.
A production branch will be started in a couple of weeks, and the "Start Autoplot" link at the top of
autoplot.org will run this version.
Feedback on the function and quality of this release is greatly appreciated!
Data is input from:
- ASCII files (.dat,.txt)
- CSV files (.csv)
- Binary files (.bin)
- CDF files(.cdf)
- Excel spread sheets (.xls)
- das2Streams (.d2s or .das2Stream)
- ViRBO's TSDS server
- CDAWeb data server (vap+cdaweb:)
- das2servers (vap+das2server:)
- QStreams (.qds), QDataSet on a das2Stream
- Plasma Wave Group das2 Server
- NetCDF files (.nc,.ncml)
- HDF5 files (.h5,.hdf5)
- DODs servers (.dds)
- Cluster Exchange Format files (.cef)
- Fits Format Files
- Images (.jpg, .png, .gif)
- Wav audio files (.wav)
This is not complete, and limitations include:
- Quantities of rank 3 dimensionality (e.g. flux(Time,Energy,pitch) are plotted by slicing.
- Quantities of rank 4 dimensionality (e.g. flux(Time,Energy,azimuth,sector) are plotted by slicing twice.
autoplot.org is the wiki website, and contains
more information than this launch page.