Autoplot Application (20180113a)

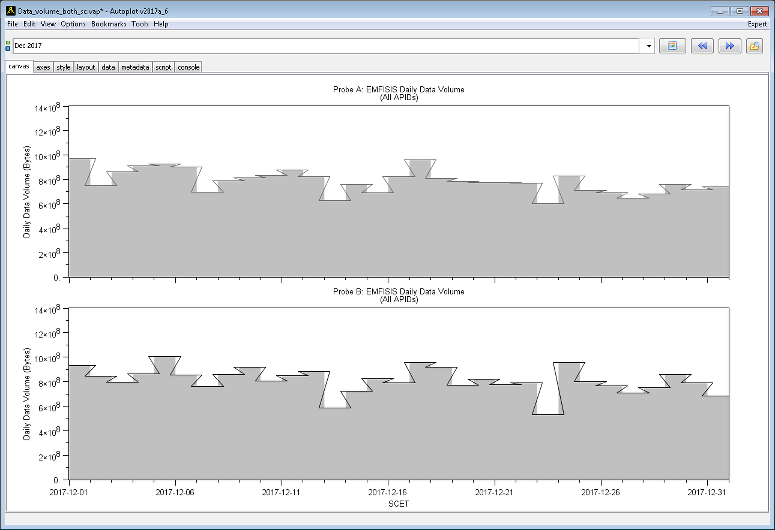
Bug 1946, introduced between v2017a_5 and v2017a_6 shows where cadence was handled inconsistently.
Autoplot attempts to allow plotting of data from many data sources, including remote CDF files and OpenDAP servers.
Datasets are identified with URIs, and by the URI's extension, data are loaded into the internal data model. Data are then
displayed by guessing the rendering method and axis ranges to provide a reasonable, useful view of the data. Data can then
be additionally processed with other operations like smooth and FFT, and Jython scripting provides a capable programming environment.
This is the Autoplot2017a branch. This is an update to the production version containing bugfixes and minor new features.
Java 7 is now required. Java 8 will be required sometime soon.
Single-jar version, autoplot.jar, can be run without network access and from the command line.
Mac DMG Release is available.
Bugfixes (2018-01-13 r21934):
- 1946: cadence was handled inconsistently for filled histogram, between the fill and the outline. Thanks, Scott!
- in ensureMonotonicAndIncreasingWithFill, where the last value was assigned even though the value was not monotonic. Thanks, Ivar!
- updating QC status properly repaints.
- 1939: FILL_VALUE is now propagated to CDF. Thanks, Ivar!
- 1944: invalid .jy reference in the address bar would prevent "load" action on script panel.
- improve error feedback when time location is added to time location.
- colons in filenames of pngwalks are again handled properly. Correct interpolation used to make thumbnails of small images, and properly handle .gif files.
- downloadResourceAsTempFile assumed it had a monitor, and old code example used None for monitor.
- 1942: limits on interpolation in synchronize.
- collapse GUI needs to check to avoid runtime errors.
- 1941: orphaned monitor with aggregation.
- format to CDF removes old CDF file before writing new one, so new result is not affected. Thanks, Ivar!
Older Bugfixes:
- 1935: time range GUI read recent timeranges on the event thread, which could hang the GUI. Thanks, Ivar!
- corrections to export-to-cdf code, when TT2000 is used, to VALID_MIN and VALID_MAX, and the units. Thanks, Ivar!
- "which range" dialog is properly centered.
- corrections to series control GUI, where ReferenceValue was mislocated.
- refactor slicers so a top painter is used instead of subclassing.
- corrections to HAPI client's caching, cached streams are zipped.
- findbugs RCN_REDUNDANT_NULLCHECK_OF_NONNULL_VALUE. Thanks, Findbugs!
- HAPI getInfo needs to check offline status before attempting to get a URL resource.
- 1933: Bugs when offline didn't properly use ro_cache.txt setting. Thanks, Ivar!
- rte_0155056645: IndexOutOfBounds caused by new quick monotonic check. Thanks, Scott!
- SAMP listener was not properly passing the URI, should have done on event thread so old one was used. Thanks Baptiste!
- Matlab/IDL interface disables SSL checking. Thanks, Kris!
- Events bar renderer supports nominal data without x tags, using 0,1,2,... to mimic other renderers.
- Zoom/Pan mouse module uses precise wheel rotation interface, supporting precise mice and trackpads.
- Zoom/Pan shift+wheel is no longer supported, since Macs use horizontal track pad motion for this. Control+wheel still works for pan.
- 1913: extraneous question mark introduced by makeCanonical(URI) corrected.
- Data Mashup dialog add expression option properly removes human-readable label from "magnitude(x): the lengths of the vectors" and others.
- HAPI file caching failed to update download URL to include full days, resulting in partial cache files.
- trim( ds, t1,t2) handles when ds is length 1 or length 0. Thanks Ivar!
- 1924: Time Range mode allows local vap timerange to be edited, as you can with the URI selector.
- PngWalk properly decodes and encodes URIs, supporting spaces and brackets in file names.
- new cadence check of waveform data had a branch which would result in NullPointerException.
- run batch GUI new keeps track of events list GUI.
- valid(r3) where r3 had a BUNDLE_1, as with MagEIS data, would create an invalid result.
- Masafumi caught a case where new series symbol connector code was too restrictive on units.
- left vertical axis with tick labels turned off, failed to draw the ticks. Thanks, Masafumi!
- 1922: Jython script which hangs the Java session. Check for this condition and fix the situation by switching to a linear axis. Thanks, Masafumi!
- rte_0088023411: where subsetting a CDF which had non-time-varying data marked as time-varying caused RTE. Thanks, zhangzx!
- rte_0211810917: where single column ASCII files could not be read, and Sebastian's file triggered the same bug. Thanks, Sebastian!
- "Display Data" mouse module handles events data.
- file system names use / on Windows, in the cache tool.
- 2017 update of the signature for jar files. Thanks, Bernie!
- 1916: logic for working with POES dataset caused some breaks in Masafumi's data to be skipped.
- TrimDataSet trims BUNDLE_0, so that datumRange(evt[0:2]) can be used to easily get the time range.
- 1912: re-fix bug where trim would include extra point, this time without dependence on cadence. Thanks Ivar!
- recent changes in pdf support broke legacy pdf output. Thanks, Ivar and others for pointing this out!
- non-standard micro symbol was used for microseconds, making standard microseconds behave improperly and failure to render as waveform. Thanks, Chris!
- 1916: "NaN" parses to fill Datum for times. This supports breaks in timeseries. Thanks, Masafumi!
- 1912: new change to check cadence didn't properly consider conditions when issuing errors. Thanks, Ivar!
Features:
- introduce cumulativeMin and cumulativeMax to scripting.
- 617: ASCII editor improvements.
- improvements to completions in Jython script panel.
Less recent features:
- prep for smaller .vaps which can be embedded within scripts.
- vap+inline checks for eval and exec, which one can imagine could be used to attack a server.
- das2 library GraphUtil.copyPlot added to support APL. Thanks, James!
- HAPI Client can manage a cache of local files to support offline use.
- Mouse modules can provide feedback, so zoom/pan can indicate control should be used instead of shift.
- Ops.dataset is more willing to return enumeration data instead of throwing ParseException.
- add applyIndex which allows use with the mashup tool.
- loosen check for boolean named parameters of plot to support False/True, and "T". Add xscale and yscale.
- Add "blur focus" to layout to aid in debugging.
- SAMP support supports messages with das2server URLs.
- HAPI editor reports lastModified, if available.
- plot has xtickValues and ytickValues. Thanks, Masafumi!
- new autoplot_test099 allows for testing of private vaps by obfuscating tests.
- plot has symbolFill named parameter, rightAxisOf added. Thanks, Masafumi!
- Jython plot command returns tuple of (plot,plotElement). Thanks, Masafumi!
- Run Batch will print a png or pdf after each iteration.
- Introduce experimental client-side caching to the HAPI support.
- add getNextIndexStrict and getPreviousIndexStrict.
- new Autoplot icons!
- rfe609: add experimental HAPI client-side caching.
- rfe548: Jython plot command now accepts renderer, so that scripts can easily add custom renderers.
- create pngwalk tool has mode where the running Autoplot is used to generate the images, not a copy, to aid with debugging and to allow decorations.
- complexMultiply promotes rank, supporting (0+1j) * complex array.
- orbit files can now have more than three columns, where the last column is used as the label, to be more consistent with events files. Thanks Ivar!
- invokeScriptSoon allows parameters in URI, to improve usefulness to Jython scripts.
- begin support for new polar plotting mode.
- DataPointRecorder allows fill records to be inserted. Thanks Masafumi!
- Jython completions show last assignment of variable names
Known issues:
- see Source Forge
- Bugs often have a four-digit ID and can be reviewed with https://sourceforge.net/p/autoplot/bugs/<ID>/.
- Features typically have a three-digit ID and can be reviewed with https://sourceforge.net/p/autoplot/feature-requests/<ID>/.
This completes the feature set for the new production branch. No major features will be added before branching this version.
A production branch will be started in a couple of weeks, and the "Start Autoplot" link at the top of
autoplot.org will run this version.
Feedback on the function and quality of this release is greatly appreciated!
Data is input from:
- ASCII files (.dat,.txt)
- CSV files (.csv)
- Binary files (.bin)
- CDF files(.cdf)
- Excel spread sheets (.xls)
- das2Streams (.d2s or .das2Stream)
- ViRBO's TSDS server
- CDAWeb data server (vap+cdaweb:)
- das2servers (vap+das2server:)
- QStreams (.qds), QDataSet on a das2Stream
- Plasma Wave Group das2 Server
- NetCDF files (.nc,.ncml)
- HDF5 files (.h5,.hdf5)
- DODs servers (.dds)
- Cluster Exchange Format files (.cef)
- Fits Format Files
- Images (.jpg, .png, .gif)
- Wav audio files (.wav)
This is not complete, and limitations include:
- Quantities of rank 3 dimensionality (e.g. flux(Time,Energy,pitch) are plotted by slicing.
- Quantities of rank 4 dimensionality (e.g. flux(Time,Energy,azimuth,sector) are plotted by slicing twice.
autoplot.org is the wiki website, and contains
more information than this launch page.