Autoplot Application (20171012a)

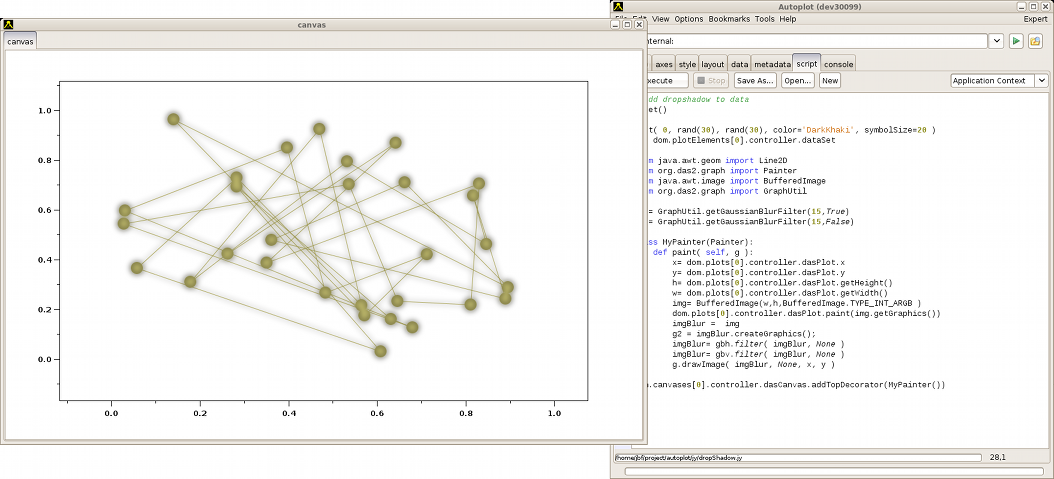
Fun with drop shadows.
Autoplot attempts to allow plotting of data from many data sources, including remote CDF files and OpenDAP servers.
Datasets are identified with URIs, and by the URI's extension, data are loaded into the internal data model. Data are then
displayed by guessing the rendering method and axis ranges to provide a reasonable, useful view of the data. Data can then
be additionally processed with other operations like smooth and FFT, and Jython scripting provides a capable programming environment.
This is the Autoplot2017a branch. This is an update to the production version containing bugfixes and minor new features.
Java 7 is now required. Java 8 will be required sometime soon.
Single-jar version, autoplot.jar, can be run without network access and from the command line.
Mac DMG Release is available.
Bugfixes (2017-10-10 r21514):
- correction to TimeParser.normalizeTimes, which would improperly round resulting in .699999. Thanks, Masafumi!
- DataPointRecorder had a time resolution limit that prevented use with waveform data. Thanks, Sadie!
- 1793: automatically switch to semicolon, allow long headers. Thanks Chris!
- 1902: improvements to pngwalk tool's write to html.
- 1905: ascii table data source depend1Values were dropped. Thanks, Victor!
- deselecting "bundle" on the ascii editor would not remove bundle switch from URI.
- 1897: tests needed for autoRangeHints.
- 1899: add and subtract operators to allow sloppiness with units.
- add a couple of completions for timerange and plots[0].yaxis.range to vap file completions after the question mark (?).
- support colorLoadOrder.vap?plots[0].yaxis.range='0+to+4'
- 1895: when rendererControl and color properties are inconsistent, let specific property override.
- vap+inline completions didn't import things properly, causing runtime error.
- CDF and HDF editor panels didn't preserve the vap+cdf or vap+hdf prefix, breaking servers which send data in files without extensions.
- fft function would assume that the cadence reported by the dataset was correct and precise, use code that looks at the timetags.
- correct completions for "plot([1,2,3],title='t',<C>)" (tab at <C>)
- if vap+jyds:/path/to/data/file.txt?script=/path/to/script.jyds was used, the data file would show in the recently used scripts list.
- correct Pngwalk tool's flickering "..." icon which is too quick to indicate busy for trivial tasks.
- TimeRangeTool pops up over center of GUI, not the address bar.
- 1884: "run batch" corrections.
Older Bugfixes:
- 1884: refactory is used in completions.
- add logging to IDL/Matlab bridge.
- clarify error where "file:///" is changed to "sftp:///jbf@nudnik" which leads to a confusing error because of the ///.
- 1888: Java9 (beta) breaks the undo code of the Jython editor, causing RTE popups.
- 1889: csv with misformatted timetag would fail with mis-marked fill value. Now record is dropped or an error raised if only the timetag is misformatted.
- 1876: Excel CSVs start with 0xFEFF, to assert UTF-8, support this in the general-purpose ascii table reader.
- rte_0003832449: indicate that the file starting with 0 (ascii null) does not appear to be ascii.
- avoid RTE with script editor in Java 9 (beta release) by doing type check.
- rte_1956645584: colorscatter and series modes interpreted data inconsistently.
- With colorScatter and turning on the symbol connector, the data is misinterpreted.
- rte_0164874230: catch runtime errors in validateFilter. Catch any exception and trivially return false.
- 1886: das2server example parameters are now used.
- rte 1931288470: matlab_jet_black0 was not properly initialized, causing RTE in some cases. Thanks, Masafumi!
- format-to-CDF's append would fail to automatically generate a new name, because it assumed all the CDF variable names were in memory. Thanks, Kristoff!
- branch of CSV reader would drop the first record. Thanks, Masafumi!
- RGB Image Renderer allows sloppiness in the units, to avoid runtime error during paint.
- in-line Jython scripts would show expression as enumerated data, instead of resolving it, because of link(name) failure.
- another round of Findbugs, focusing on unnecessary Thread synchronization and find-single-character in String.
- 1884: "import autoplot as ap" was broken since the org.virbo refactoring.
- 1511: tighten up code which could reset the y axis autorange property because " " was in the .vap for a filter.
- bugfix: when pngwalk template is file:///home/jbf/ct/hudson/artifacts/test070*.png, the filename was clipped improperly.
- 1883: jython PyQDataSet corrects handling of "property" calls, and __tojava__, to correct mutability bugs.
- cdf export writes DEPEND_1 and DEPEND_2 as non-time-varying when they are rank 1.
- 1882: jython indexing bug, where SPE[i,j,r] is used with scalars i and j, and array r.
- 1881: weightsDataSet always returns a BundleWeightsDataSet, even for simple bundles, because fill was not properly handled.
- rte 0579778410: some path resulted with NullPointerException in CDF editor panel
- 1852: metadata tab for join dataset doesn't show properties of each joined data set.
- 1869: listings of Hudson http showed where subdirectories show up in listings (ls /a/->/a/b/c/), causing strange problems.
- 1875: preserve the scientist's timerange
- 1129: unnecessary 1-second delay in waitUntilIdle when producing pngwalks corrected.
- round of FindBugs cleanup.
- Corrections to waveform dataset plotting with Series renderer mode.
- 1878: FlattenWaveformDataSet can now detect that result is not monotonic.
- 1878: FlattenWaveformDataSet would improperly propagate fill metadata for the DEPEND_0 values.
- 1876: first line of CSV was always handled as a header, dropping the first record.
- 1876: Excel CSVs start with 0xFEFF, to assert UTF-8, which also caused problems.
- error message for dataset length mismatch was mis-reported in validate.
- in PNGWalkTool, show unique part of filenames in .../*/foo/bar.png. Before bar.png was shown for each image.
- item parameter works properly for das2server dialog for all streams now.
- Don't draw lines at tick locations when "opposite axis" is used.
- 1871: many timerange text fields don't use history. Thanks, Dan!
- flattenRank2 always returns a rank 2 dataset, generating 0,1,2,... when DEPEND_0 or DEPEND_1 is missing.
- 1873: incorrect reset of slices filter. Thanks, Joe!
- 1869: restore function of pngwalk:http://jfaden.net/hudson/job/autoplot-test070/*/artifact/test070_008.png.
- Ivar's script caught where new code didn't handle fill properly because BUNDLE_1 hid it.
- convertUnitsTo now checks that a BUNDLE_0 is not present, which might have old UNITS within. Thanks, Ivar!
- 1868: where with append triggered a branch where an immutable dataset's internal buffer was accessed with write code. Thanks, Kristoff!
- 1867: AverageTableRebinner interpolate Y before interpolating X, to support MMS FPI interleaved sample modes.
- rank 4 support was never implemented for ListIndexDataSetIterator, so inline with where would not work.
- 1866: catch CDF recCount=0, which causes reader to enter infinite loop, triggered when [200:300] was used and a non-time-varying DELTA_PLUS was found.
- 1801: dataset iterator is inordinately slow, put in optimal loops for collapse of rank 4 data.
- rte_0164874230: index out of bounds on Slice operation editor panel. Thanks, Kris!
- bug where rank 2 DEPEND_3 wasn't sliced properly is corrected. Thanks, Arya!
- 1865: add a little hysteresis to the LanlNNRebinner, so it doesn't flop back and forth with axis changes.
- small round of findbugs, including one real bug in DigitalRenderer with xaxis units.
- rte_1708171669: space in CDAWeb filter would cause RTE.
- 1860: fill data within bundles of data is marked as fill in the metadata tab.
- fix the setUnits filter, where it was using an old method. Thanks, Kristoff!
- 1858: extend autorange to include all data when bundled data has different units.
Features:
- DatumRangeUtil's time range parser properly throws parse exception with "0 to 4" (or any year<1000.)
- PNGWalk save as has checkbox to reduce the image by 60%, to save time in releases.
- "Run Batch" allows times to be loaded from events file.
- AutoplotServer has --nomessages which turns off message bubbles.
- ServletInfo reports memory consumed and other useful information.
- ServletInfo of Autoplot Servlet now checks whitelist before showing server-side information.
- three new plot symbols added (trianglesWest, trianglesEast, trianglesSouth).
- X11 color names like "DarkRed" can be used.
- .vap format supports transparent colors now.
- symbol size and line thickness spinners allow up to 20 pixels.
- add "bounds" render type, which fills in the region between min and max channels.
- rfe521: aggregate rank 3 images by adding an index and joining them together.
- add http://.../hapi/info trigger for future support of SPASE accessURLs.
- string representation of complex data used (1.23+4.56j)
- add complexConj and complexMultiply functions.
- loosen check for CDF VAR_TYPE to support ESA.
Less recent features:
- SAMP file references are downloaded if necessary.
- 064: CDF formatting "bundle" named parameter allows bundle dataset to be written to CDF in separate variables.
- 515: improve support for new colorbars created in scripts.
- 592: allow remote scripts to be accessed over SFTP.
- add magnitude (of vectors) to the tree of filter operations.
- 591: Image URIs can be flipped horizontally or vertically, with ?xaxis=[360.,0,0.,2047].
- 064: ExportDataBundle is experimental system from aggregating a set of URIs for export into ascii tables, CDF files, and IDL savesets.
- New compile script for Autoplot which compiles within minutes instead of 20+ minutes, should have no effect
- 588: allow 64-point rank 2 waveforms. Bugfix were waveform scheme test didn't check rank of offsets, which can now be rank 2.
- synchronize functions allow rank2 data, where each channel is synchronized as a rank 1 dataset.
- DataPointRecorder (used with digitizing) allows the units to be reset. Thanks, Bill!
- matlab_jet_black0 color table added. Thanks, Seth!
- "lastyear" keyword supported in timeranges, to indicate the last year boundary.
- time range dialogs properly show recent timeranges.
- das2server dialog shows a droplist of items when they are identified by the server.
- Update RBSP orbits to Feb 2017.
- DasAxis foreground color is exposed in the property editor, under the controller node.
- 585: experimental TriScatRebinner added, to draw spectrograms from scatter data using Delauney triangulation.
- support new scheme, rank2WaveformRank2Offsets in hugeScatter and series renderers, for analysis with Ivar's new CDF files.
- rfe528: after years of being stuck with the "BoxSelected" mistake, this is finally corrected to "boxSelected"
- IDL/Matlab interface includes method for clearing used memory. Thanks, Masafumi!
Known issues:
- see Source Forge
- Bugs often have a four-digit ID and can be reviewed with https://sourceforge.net/p/autoplot/bugs/<ID>/.
- Features typically have a three-digit ID and can be reviewed with https://sourceforge.net/p/autoplot/feature-requests/<ID>/.
This completes the feature set for the new production branch. No major features will be added before branching this version.
A production branch will be started in a couple of weeks, and the "Start Autoplot" link at the top of
autoplot.org will run this version.
Feedback on the function and quality of this release is greatly appreciated!
Data is input from:
- ASCII files (.dat,.txt)
- CSV files (.csv)
- Binary files (.bin)
- CDF files(.cdf)
- Excel spread sheets (.xls)
- das2Streams (.d2s or .das2Stream)
- ViRBO's TSDS server
- CDAWeb data server (vap+cdaweb:)
- das2servers (vap+das2server:)
- QStreams (.qds), QDataSet on a das2Stream
- Plasma Wave Group das2 Server
- NetCDF files (.nc,.ncml)
- HDF5 files (.h5,.hdf5)
- DODs servers (.dds)
- Cluster Exchange Format files (.cef)
- Fits Format Files
- Images (.jpg, .png, .gif)
- Wav audio files (.wav)
This is not complete, and limitations include:
- Quantities of rank 3 dimensionality (e.g. flux(Time,Energy,pitch) are plotted by slicing.
- Quantities of rank 4 dimensionality (e.g. flux(Time,Energy,azimuth,sector) are plotted by slicing twice.
autoplot.org is the wiki website, and contains
more information than this launch page.