Autoplot Application (20161205a)

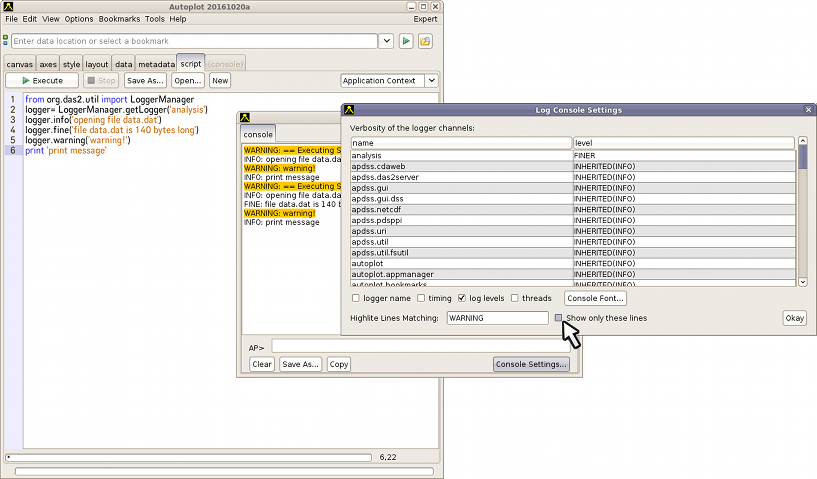
Script uses Java logging, and Autoplot provides a menu for controlling logger verbosity.
Autoplot attempts to allow plotting of data from many data sources, including remote CDF files and OpenDAP servers.
Datasets are identified with URIs, and by the URI's extension, data are loaded into the internal data model. Data are then
displayed by guessing the rendering method and axis ranges to provide a reasonable, useful view of the data. Data can then
be additionally processed with other operations like smooth and FFT, and Jython scripting provides a capable programming environment.
This is the Autoplot2016a branch. This is an update to the production version containing bugfixes and minor new features.
Java 7 is now required. Java 8 will be required sometime soon.
Single-jar version, autoplot.jar, can be run without network access and from the command line.
Experimental Mac Release is available.
Bugfixes (2016-12-05 r20106):
- 1731: get screenshot for second display.
- rte_2095724092: don't go into the completions editor when there is no extension.
- 1727: break into stack of plots reconnects time series browse to new x-axis.
- units on bin_plus and bin_minus in HAPI client.
- rte_2071759301: rename file when old file wasn't set caused NullPointerException.
- in data mash up, handle cancel in "add function" dialog.
- setXAxis of DasPlot was incorrect. Thanks, James!
- corrections to HAPI support for CDAWeb.
- 1724: autoplotapp.py is constantly rewritten, causing occasional "File not found" popups.
- IDL/Matlab interface provides access to more datasets in qstreams.
- 1722: qstreams with arbitrary qdataset properties.
- 1718: HDF5 supports DELTA_PLUS_VAR, DELTA_MINUS_VAR metadata.
- 1718: LANL NN with log-spaced x-tags.
- test002 showed where -INFs were getting into Autohistogram and causing unnecessary warnings.
- 1714: slice function of NetCDF (and HDF) result didn't handle DEPEND meta dataset property.
- 1714: Brian showed where HDF5 variable was ISTP, but its DEPEND datasets were not.
- something changed on Mint Linux display (or java version) and get screenshot didn't work on one of the screens.
- old nbproject areas (ant build) rebuilt from scratch, reducing incremental build time from 20sec to 5sec.
- rte_1736345160: improperly-localized strings caused RTE in layout tab's "make taller" and other buttons. Thanks, Andre!
- rte_0095613254: if the vap+cdf: was missing from the URI, Tool->"Mash Data" would fail.
- stacked histogram correctly handles data where points are more course than the resolution and a peaks plane is found, so show hourly averages.
- Help->"About this release" didn't point at the correct URL.
- 1708: digitizer component fails when the first column was not time, because code assumed times with timeFormatter.
- data set selector component setValue would add "%20" when there was an extra space at the end when cut-n-paste URIs.
Older Bugfixes:
- rte_1741708130: rendering of rank 3 waveform would fail w/NullPointerException when within one packet. Thanks, Nhan!
- slightly tighten the check for JSON headed-ascii files by looking for a colon between the braces.
- Use last HAPI server by default. Jon's elasticbeanstalk is the default server.
- reducex supports rank 2 bundle without DEPEND_0, and independent tags in the first column.
- demo HAPI server had Jython library issues, where it was assumed that VirboAutoplot was on the path.
- html data source would fail with http://www-pw.physics.uiowa.edu/~jbf/autoplot/users/jeremy/20161027/cubs.html, because wrong index was used.
- eventsBar last color used was used for the gantt label colors, instead of the color property.
- vap+das2Server and vap+das2server were not treated as equivalent, causing "add plot from" initialization feature to fail.
- 1699: noise on FiltersChainPanel dialog.
- launcher script for jumbojars would insert a space, causing --help to fail
- more findbugs cleanup (nothing serious)
- Move local data cache has progress bar and allows cancel.
- Binary Data Source gets format keyword, and properly supports %c.
- IDL/Matlab interface supports reading PLANE_0 correlated planes.
- HAPI client supports binary, when format=binary is added to URI.
- 1695: dashup issues pointed out by Kris, including my functions persist and proper support for TSB.
- setDepend0Cadence no longer resets axes and plot type. Thanks, Chris!
- Binary Data Source includes completion for Nybbles.
- 1693: ephemeris/tca forces $Y-$m-$d when $Y-$j should be shown. Thanks, Chris!
- StackedHistogram allows inconvertible units.
- properly register the LogConsole as the handler for log messages, so that LoggerManager.getLogger("myanalysis") is handled.
- jython completions are sorted
- Round of findbugs code cleanup (no visible bugs found).
- Bookmarks demo1 changed to CDAWEB, after years of problems with the OpenDap URIs.
- Added ability for each plane in a TableDataSet to have its own properties. Thanks, Chris!
- stackedHistogram labels were not set properly for doInterpretMetadata. Thanks, Chris!
- 1691: rank >0 datasets treated as number type, implying that __float__ could be called.
- 1686: always enter the editor for the open local action, so that Overplot or Plot Below can be selected.
- Digital renderer properly sets the font. Unify rank2 and rank1 code for consistent behavior.
- DafaultTimeSeriesBrowse improves error feedback by checking for null uri.
- finally figure out why vertical axis sometimes clips the top tick.
- Some automatic layout actions would occur when autolayout switch was off. Thanks, Ivar!
- 1687: completions on jython import package names shows javadoc
- add filters dialog is resizeable. Thanks Chris!
- Ed found "hey man" debugging print statement left in code. Now a useful message is printed.
- clarify dbAboveBackgroundDim1 GUI, and allow selection of 10 or 20 factor for fields intensity or power. Thanks Chris!
- DecimalFormat, often used to display decimal numbers and in das2streams and QStreams, was using banker's rounding (HALF_EVEN), instead of HALF_UP.
- various bugs with the HAPI GUI.
- QStream ASCII formats used banker's rounding, so 44.5 would have been rounded to 44.0. Now 0.5 is rounded up.
- 1679: HAPI JSON would confuse Rich ASCII support.
- improve feedback for qstreams when values are found in both the packet descriptor and in the packets.
- applyIndex supports BUNDLE_i.
- Series renderer plotSymbols would show when units were inconvertible, but then connectors would refuse to paint. Now both will paint with a warning.
Features:
- HAPI shows descriptions if available.
- data mash-up tool supports string arguments and constants like QDataSet.UNITS
- metadata tab allows access to the metadata for each bundled dataset.
- update internal orbits, and include 2017 leap second.
- "run batch" feature allows jython scripts to be run for a series of inputs.
- 20000th SVN revision!
- layout tab has "move to top" menu item
- lookupAxis supports horizontal axis.
- HAPI data source makes SPASE link clickable.
- 543: support for time zone offsets in ISO8601 strings.
- HAPI data source supports JSON data response.
Less recent features:
- 541: Need for BIN_MAX and BIN_MIN properties to state extent in the same units as the data. Thanks, Chris!
- 538: Introduce synchronize checkbox to vap+line mash-up scripts, which interpolates all data to the same timetags. Thanks Kristoff!
- 537: show progress and allow cancel on move cache. Thanks, Dan!
- TimeRangeEditor had next/previous buttons and button to copy start time to end time.
- HAPI Server has checkbox to request binary transfers, when they are available.
- Script plot command gets yautoRangeHints switch, like yautoRangeHints="includeZero=T"
- LookupAxis introduced, which draws additional ticks for another dataset.
- checkbox in the console shows only the filtered log records. Thanks, Ivar!
- If annotation bubble text is "", then don't draw the bubble, to provide some way one label can have multiple arrows. Thanks, Sebastian!
- Demo HAPI server supports gzipped responses and binary responses.
- DigitalRenderer has plotSymbol property to locate the text precisely.
- embed Google fonts Roboto and ArchitectsDaughter so that all platforms have these fonts.
- rfe529: support for the HAPI Server. Make the unrecognized metadata available.
- BinaryDataSource completions include time24, which has been available for a while.
- 531: Html parser has new streaming capability, to support servers
- Logger control decorated with even/odd backgrounds. Thanks, Ed!
- rfe247: HAPI data streams, with HAPI JSON headers, can be read in now as a rich ascii dialect
- The console Logger control uses a table now, and allows sorting by log level.
- HTML parser allows the units to be set externally. "N/A" was causing the units to come back as ordinal units.
- DataPointRecorder allows the time format to be controlled.
Known issues:
This completes the feature set for the new production branch. No major features will be added before branching this version.
A production branch will be started in a couple of weeks, and the "Start Autoplot" link at the top of
autoplot.org will run this version.
Feedback on the function and quality of this release is greatly appreciated!
Data is input from:
- ASCII files (.dat,.txt)
- CSV files (.csv)
- Binary files (.bin)
- CDF files(.cdf)
- Excel spread sheets (.xls)
- das2Streams (.d2s or .das2Stream)
- ViRBO's TSDS server
- CDAWeb data server (vap+cdaweb:)
- das2servers (vap+das2server:)
- QStreams (.qds), QDataSet on a das2Stream
- Plasma Wave Group das2 Server
- NetCDF files (.nc,.ncml)
- HDF5 files (.h5,.hdf5)
- DODs servers (.dds)
- Cluster Exchange Format files (.cef)
- Fits Format Files
- Images (.jpg, .png, .gif)
- Wav audio files (.wav)
This is not complete, and limitations include:
- Quantities of rank 3 dimensionality (e.g. flux(Time,Energy,pitch) are plotted by slicing.
- Quantities of rank 4 dimensionality (e.g. flux(Time,Energy,azimuth,sector) are plotted by slicing twice.
autoplot.org is the wiki website, and contains
more information than this launch page.