Autoplot Application (20161102a)

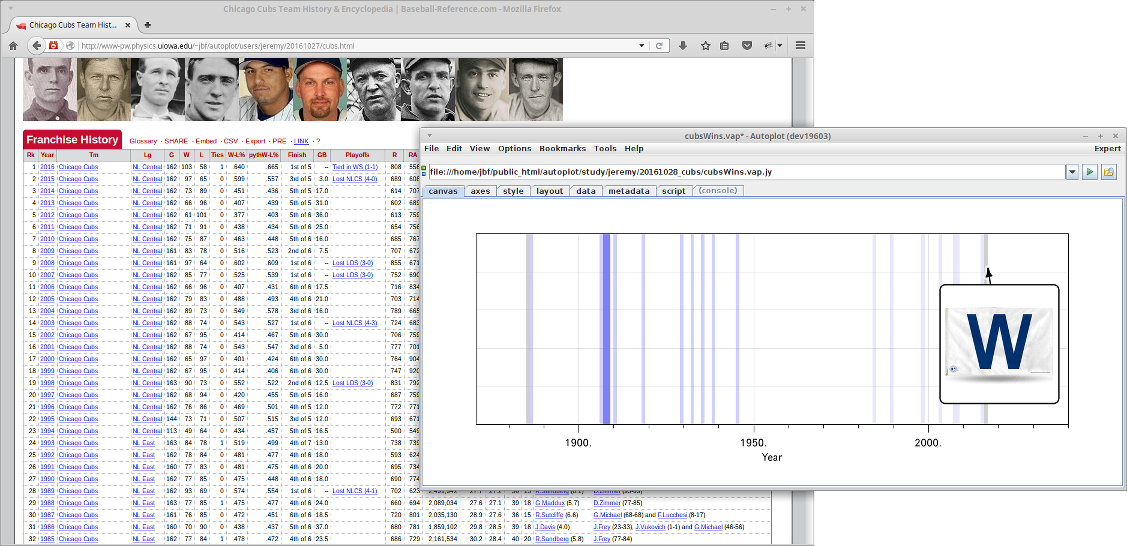
The Chicago Cubs are one game away from winning the World Series, which they have not done in 108 years. The "W" flags, which before television were flown on Wrigley stadium to indicate a win, will be flying today! script data
Autoplot attempts to allow plotting of data from many data sources, including remote CDF files and OpenDAP servers.
Datasets are identified with URIs, and by the URI's extension, data are loaded into the internal data model. Data are then
displayed by guessing the rendering method and axis ranges to provide a reasonable, useful view of the data. Data can then
be additionally processed with other operations like smooth and FFT, and Jython scripting provides a capable programming environment.
This is the Autoplot2016a branch. This is an update to the production version containing bugfixes and minor new features.
Java 7 is now required. Java 8 will be required sometime soon.
Single-jar version, autoplot.jar, can be run without network access and from the command line.
Experimental Mac Release is available.
Bugfixes (2016-11-01 r19866):
- reducex supports rank 2 bundle without DEPEND_0, and independent tags in the first column.
- demo HAPI server had Jython library issues, where it was assumed that VirboAutoplot was on the path.
- html data source would fail with http://www-pw.physics.uiowa.edu/~jbf/autoplot/users/jeremy/20161027/cubs.html, because wrong index was used.
- eventsBar last color used was used for the gantt label colors, instead of the color property.
- vap+das2Server and vap+das2server were not treated as equivalent, causing "add plot from" initialization feature to fail.
- 1699: noise on FiltersChainPanel dialog.
- launcher script for jumbojars would insert a space, causing --help to fail
- more findbugs cleanup (nothing serious)
- Move local data cache has progress bar and allows cancel.
- Binary Data Source gets format keyword, and properly supports %c.
- IDL/Matlab interface supports reading PLANE_0 correlated planes.
- HAPI client supports binary, when format=binary is added to URI.
- 1695: dashup issues pointed out by Kris, including my functions persist and proper support for TSB.
- setDepend0Cadence no longer resets axes and plot type. Thanks, Chris!
- Binary Data Source includes completion for Nybbles.
- 1693: ephemeris/tca forces $Y-$m-$d when $Y-$j should be shown. Thanks, Chris!
- StackedHistogram allows inconvertible units.
- properly register the LogConsole as the handler for log messages, so that LoggerManager.getLogger("myanalysis") is handled.
- jython completions are sorted
- Round of findbugs code cleanup (no visible bugs found).
- Bookmarks demo1 changed to CDAWEB, after years of problems with the OpenDap URIs.
- Added ability for each plane in a TableDataSet to have its own properties. Thanks, Chris!
- stackedHistogram labels were not set properly for doInterpretMetadata. Thanks, Chris!
- 1691: rank >0 datasets treated as number type, implying that __float__ could be called.
- 1686: always enter the editor for the open local action, so that Overplot or Plot Below can be selected.
- Digital renderer properly sets the font. Unify rank2 and rank1 code for consistent behavior.
- DafaultTimeSeriesBrowse improves error feedback by checking for null uri.
- finally figure out why vertical axis sometimes clips the top tick.
- Some automatic layout actions would occur when autolayout switch was off. Thanks, Ivar!
- 1687: completions on jython import package names shows javadoc
- add filters dialog is resizeable. Thanks Chris!
- Ed found "hey man" debugging print statement left in code. Now a useful message is printed.
- clarify dbAboveBackgroundDim1 GUI, and allow selection of 10 or 20 factor for fields intensity or power. Thanks Chris!
- DecimalFormat, often used to display decimal numbers and in das2streams and QStreams, was using banker's rounding (HALF_EVEN), instead of HALF_UP.
- various bugs with the HAPI GUI.
- QStream ASCII formats used banker's rounding, so 44.5 would have been rounded to 44.0. Now 0.5 is rounded up.
- 1679: HAPI JSON would confuse Rich ASCII support.
- improve feedback for qstreams when values are found in both the packet descriptor and in the packets.
- applyIndex supports BUNDLE_i.
- Series renderer plotSymbols would show when units were inconvertable, but then connectors would refuse to paint. Now both will paint with a warning.
Older Bugfixes:
- blurTsbUri would fail when a data source was removed, but one of its URIs was still in the history.
- 1677: interpolate2D should allow interpolation along edges when the opposite edge contains fill
- interpolate2D with two rank 0 datasets for xx and yy would cause RTE.
- 1672: layout panel was failing to repaint when plots were added.
- 1636: if statements in Jython scripts could mess up code that would extract the getParam calls to create GUI. Thanks Ivar!
- 1671: contour insert fill values but property is not set
- 1670: spectrogram averaging code assumed that 0*NaN would be 0. Thanks, Ivar!
- 1669: "common path" code, which tries to obscure local references in .vap.zip files, would use "" for data filename (and it would work, surprisingly).
- add a bit of fuzz to the fill value test, after seeing a d2s with 1e31 failing to detect fill
- 1499: Brian's events file (two ISO8601/line) fails to parse.
- 1667: color icons not shown in events list tool.
- rfe521: devel-release had a bug where events list couldn't be aggregated
- 1666: Jython ds[i,j] would return rank 1 when i was integer and j was rank 0 dataset.
- rte_1104366814: format .wav "data extent is too great" message didn't consider scale.
- ImageDataSource would use Datum is TYPICAL_MAX and TYPICAL_MIN, instead of Number
- slices GUI formatted command that was then not supported (: vs ':')
- code to repaint layout panel was triggering itself, causing unnecessary paints.
- 1665: new jumpiness when click-n-drag on x axis.
- 1661: new version of CDF library supports export to CDF using append now works on Windows.
- 1653: clean up "Add additional ticks" dialog.
- 1662: smooth function fails when fill exists in the first boxcar. Thanks Kristoff!
- 1660: Jython setItem assignment of ds[i,j] to rank 0 dataset. Thanks Kristoff!
- rte_0520679247: don't do separate check for timeSeriesBrowse part of URI, which produces confusing messages. Thanks, Mark!
- 1612: recent change would cause RTE when all data was fill.
- 1659: "monitor finished was called twice" when reading das2stream from das2server. Thanks Masafumi!
- 1658: failure to start jython because pylisting.txt, clarify error message
- 1633: ImageDataSet renderer recoded to extract just the visible portion
- 1653: add explicit "clear" button to the ephemeris dialog.
- rfe499: SciPy Plasma colorbar added. Thanks, Steve!
- rfe509: maybeCreateDasPeer should check headless before adding an export data button to the horizontal and vertical slice.
Features:
- 538: Introduce synchronize checkbox to vap+line mash-up scripts, which interpolates all data to the same timetags.
- TimeRangeEditor had next/previous buttons and button to copy start time to end time.
- HAPI Server has checkbox to request binary transfers, when they are available.
- Script plot command gets yautoRangeHints switch, like yautoRangeHints="includeZero=T"
- LookupAxis introduced, which draws additional ticks for another dataset.
- checkbox in the console shows only the filtered log records. Thanks, Ivar!
- If annotation bubble text is "", then don't draw the bubble, to provide some way one label can have multiple arrows. Thanks, Sebastian!
- Demo HAPI server supports gzipped responses and binary responses.
- DigitalRenderer has plotSymbol property to locate the text precisely.
- embed Google fonts Roboto and ArchitectsDaughter so that all platforms have these fonts.
- rfe529: support for the HAPI Server. Make the unrecognized metadata available.
- BinaryDataSource completions include time24, which has been available for a while.
- 531: Html parser has new streaming capability, to support servers
- Logger control decorated with even/odd backgrounds. Thanks, Ed!
- rfe247: HAPI data streams, with HAPI JSON headers, can be read in now as a rich ascii dialect
- The console Logger control uses a table now, and allows sorting by log level.
- HTML parser allows the units to be set externally. "N/A" was causing the units to come back as ordinal units.
- DataPointRecorder allows the time format to be controlled.
Less recent features:
- rfe247: experiment with allowing the data source to be edited without resetting everything else. Thanks Chris, Bob, and Bill!
- Tooltips indicate description of filters in Filter Chain. Thanks, Chris!
- rfe526: add test for rank join of rank 2 waveforms, to support cases where sampling rate changes for example.
- dataset index range checking flag is enabled by default now, improving error message precision.
- sin,cos,atan,etc added to Mash Up tool.
- add fillValue, validMin and validMax keywords to NetCDF reader.
- AMDA had a .nc file where the times were 1997223000009297, so special code is added to look for this case.
- script:/tmp/foo.jy, /tmp/foo.jy, are all treated as "--script /tmp/foo.jy" to support running from the command line.
- BinaryDataSource has fillValue and units keywords to support PDS4.
- abstract dataset trim(0,len) returns self, improving performance slightly
- unwrap function to mimic SciPy and Matlab function
- add hilbertFrequency, hilbertPhase, and hilbertEnvelope filters.
- hilbert function added.
- unbundle supports rank 2 unbundle.
- addPlot(rowSpec,columnSpec) command added
- rfe523: format to wav now scales data by default.
- rfe521: aggregation of images is supported with new rules for aggregation.
- Improvements to applot.py, which supports plotting from C Python.
- Introduce ifft, for inverse transforms, to support hilbert function.
- bug1664: CDF data source URI keyword replaceLabels=T will use the channel values to label (e.g. 14eV instead of ch01). Thanks, Cindy!
- BinaryDataSource editor supports tab
- trim1 which trims elements from the first dimension, not just the zeroth.
- smooth1 which smooths over the first dimension, not just the zeroth.
- add matplotlib plasma colorbar
- rfe515: add DOTS where the dots/spacing is [0,3]
Known issues:
This completes the feature set for the new production branch. No major features will be added before branching this version.
A production branch will be started in a couple of weeks, and the "Start Autoplot" link at the top of
autoplot.org will run this version.
Feedback on the function and quality of this release is greatly appreciated!
Data is input from:
- ASCII files (.dat,.txt)
- CSV files (.csv)
- Binary files (.bin)
- CDF files(.cdf)
- Excel spread sheets (.xls)
- das2Streams (.d2s or .das2Stream)
- ViRBO's TSDS server
- CDAWeb data server (vap+cdaweb:)
- das2servers (vap+das2server:)
- QStreams (.qds), QDataSet on a das2Stream
- Plasma Wave Group das2 Server
- NetCDF files (.nc,.ncml)
- HDF5 files (.h5,.hdf5)
- DODs servers (.dds)
- Cluster Exchange Format files (.cef)
- Fits Format Files
- Images (.jpg, .png, .gif)
- Wav audio files (.wav)
This is not complete, and limitations include:
- Quantities of rank 3 dimensionality (e.g. flux(Time,Energy,pitch) are plotted by slicing.
- Quantities of rank 4 dimensionality (e.g. flux(Time,Energy,azimuth,sector) are plotted by slicing twice.
autoplot.org is the wiki website, and contains
more information than this launch page.