Autoplot Application (20160708b)

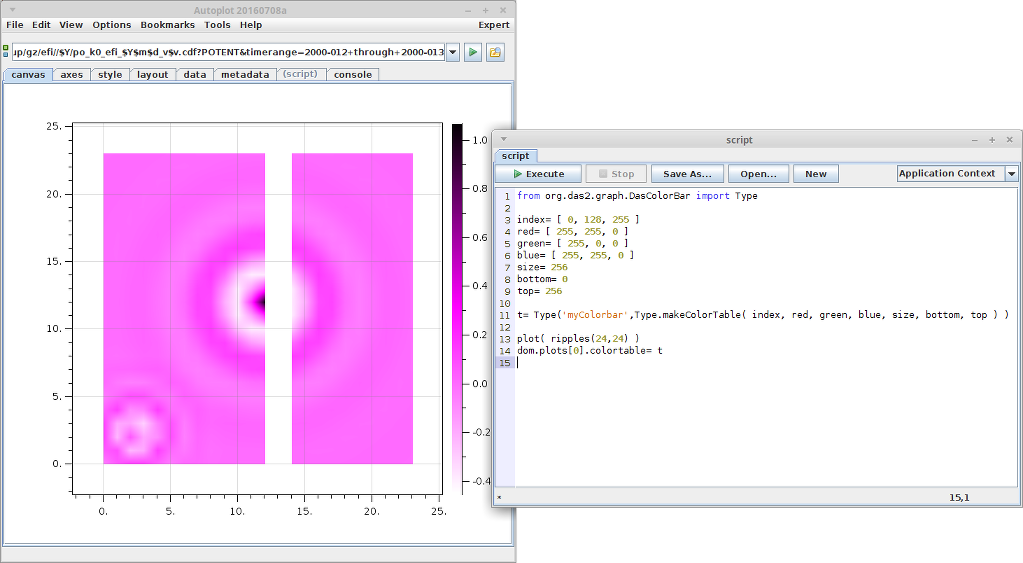
Experiments with creating a new colorbar from scripts.
Autoplot attempts to allow plotting of data from many data sources, including remote CDF files and OpenDAP servers.
Datasets are identified with URIs, and by the URI's extension, data are loaded into the internal data model. Data are then
displayed by guessing the rendering method and axis ranges to provide a reasonable, useful view of the data. Data can then
be additionally processed with other operations like smooth and FFT, and Jython scripting provides a capable programming environment.
This is the Autoplot2016a branch. This is an update to the production version containing bugfixes and minor new features.
Java 7 is now required. Java 8 will be required sometime soon.
Single-jar version, autoplot.jar, can be run without network access and from the command line.
Experimental Mac Release is available.
Bugfixes (2016-06-28 r19148):
- 1625: writeHTML PngWalk crashes when --update is used. Thanks, Jon N.!
- 1624: local .gz files are not uncompressed automatically.
- 1569: check for zero in __add__ function, to support Jython sum operation.
- 1623: jython index bug, where Jython list was misinterpretted as the single index for each dimension.
- 1621: wrong ordinal selected when table is sorted by ordinal.
- test005_014 corrected, as old site http://satdat.ngdc.noaa.gov/sem/goes/data/avg/$Y/A105$y$m.TXT appears to be gone.
- 1616: hooks in pngwalk to allow for scripting new apps. Add switch to disable automatic digitizer recording.
- rte_1585690286: code failed to check if null was found for units.
- 1541: Larry's Jython code where dom.dataSourceFilters would result in Concurrent exception
- 1618: botched bugfix breaks File->"Add Plot From..."->CDAWeb
- startDigitizer is a public method now, and startQC can be called multiple times without complaint.
- rte_0400646374: Index out of bounds when QC is running and pngwalk is empty. Thanks Ivar!
- rte_0370111585: SliceFilterEditorPanel.validateFilter assumed data was a QUBE.
- rte_0724070161: address inconsistent state associated with Time Series Browse observed by two people.
- corrections in digitizer (DataPointRecorder) when column sorts are used.
- corrections to pngwalk digitizer when digitizing plots without JSON metadata.
- catch annoying 403 error message that shows at LANL.
- 1582: tweak to the guessCadence logic shown by Rosie's data.
- 1594: HDF reader cannot find data in sweswi_data_12min_year1999.hdf. Now groups are supported.
- Rich ASCII code would run on any comment block containing {}, causing error message popup for some files.
- 1490: Improvements to Rich ASCII output following meeting with LANL folks.
- rte_1147829159: update the default pngwalk bookmarks, connect to github bookmarks file for easier maintenence.
- 1612: Mark's example showed where very negative Long for TT2000 was treated inconsistently and mucking up autoranging.
- updates to example scripts in svn.
- 1268: back out until this can be fixed carefully. (Bug is avoid download on the event thread in addPlot dialog)
- Recent change to Add Plot dialog would result in incomplete URIs and other strange errors.
- warning about using a timerange with a non-TSB getDataSet call removed. It wasn't effective.
- 0899: avoid extraneous load of data when createPngWalk is used to create single pngs.
Older Bugfixes:
- bugfix: simplifyScriptToGetParams didn't consider comments, creating a confusing situation where it wasn't clear why it was failing to parse.
- 1603: check for ordinal units in closestIndex function.
- putProperty( ds, QDataSet.SCALE_MIN, rank0qds ) supported.
- Code put in to automatically name the default plane of das2stream didn't consider that there might already be a plane "y", and uses the name property instead for the default value. Thanks Chris and Bill!
- "UNKNOWN ERROR" message was printed when CreatePngwalk was cancelled.
- add noCheckCertificate setting to work around where LANL's certificate is suddenly not working.
- dataset([d1,d2]) where d1 and d2 are Datums of different but convertible Units created incorrect dataset. Thanks Ivar!
- 1599: experiment with invokeLater to avoid hang seen with TimeRangeEditor.
Features:
- allow clients to declare new types of colorbars.
- UInt24DataSet added so that we can read pairs of two nybbles to get data deom LWA telescope.
- BinaryDataSource can now read data as array of nybbles.
- PNGWalkTool provides more hooks for new Jython apps, including magnifier and auto-increment.
- planet.physics.uiowa.edu is the default das2server now.
- Refactor HTTPFileSystem to make the code a little easier to follow.
- PNGWalkTool provides a method for programmatically adding QC metadata.
- HDF reader supports structures.
- PngWalkTool digitizer now includes column identifying the image.
- PngWalkTool provides mechanism for extension, where scripts can get events and can plug in small GUI.
Less recent features:
- Jython plot command gets control for spectrogram color table. Thanks Babtiste and Kristoff!
- add control to set the maximum thread count, useful for Ivar's strange .jyds bug
- add plots dialog allows up to 6 by 6 plots now, useful for things like hourly plots of a day (6x4=24).
Known issues:
This completes the feature set for the new production branch. No major features will be added before branching this version.
A production branch will be started in a couple of weeks, and the "Start Autoplot" link at the top of
autoplot.org will run this version.
Feedback on the function and quality of this release is greatly appreciated!
Data is input from:
- ASCII files (.dat,.txt)
- CSV files (.csv)
- Binary files (.bin)
- CDF files(.cdf)
- Excel spread sheets (.xls)
- das2Streams (.d2s or .das2Stream)
- ViRBO's TSDS server
- CDAWeb data server (vap+cdaweb:)
- das2servers (vap+das2server:)
- QStreams (.qds), QDataSet on a das2Stream
- Plasma Wave Group das2 Server
- NetCDF files (.nc,.ncml)
- HDF5 files (.h5,.hdf5)
- DODs servers (.dds)
- Cluster Exchange Format files (.cef)
- Fits Format Files
- Images (.jpg, .png, .gif)
- Wav audio files (.wav)
This is not complete, and limitations include:
- Quantities of rank 3 dimensionality (e.g. flux(Time,Energy,pitch) are plotted by slicing.
- Quantities of rank 4 dimensionality (e.g. flux(Time,Energy,azimuth,sector) are plotted by slicing twice.
autoplot.org is the wiki website, and contains
more information than this launch page.