Autoplot Application (20151124b)

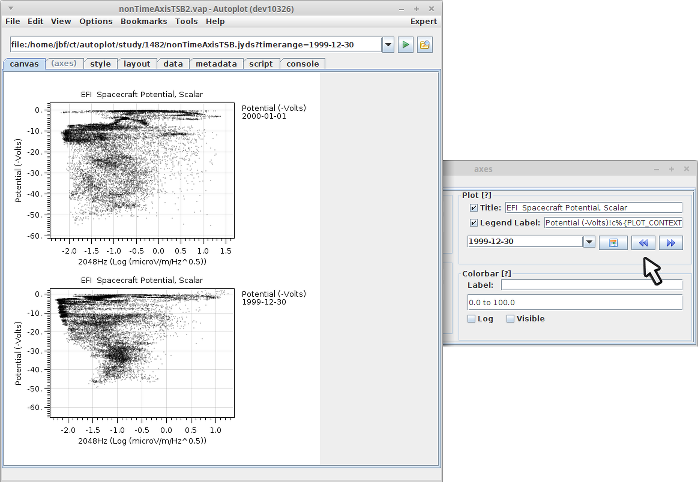
Two plots showing two different days' correlations. The legend label uses the macro %{PLOT_CONTEXT} to indicate the day.
Autoplot attempts to allow plotting of data from many data sources, including remote CDF files and OpenDAP servers.
Datasets are identified with URIs, and by the URI's extension, data are loaded into the internal data model. Data are then
displayed by guessing the rendering method and axis ranges to provide a reasonable, useful view of the data. Data can then
be additionally processed with other operations like smooth and FFT, and Jython scripting provides a capable programming environment.
This is the Autoplot2015a branch. This is an update to the production version containing bugfixes and minor new features.
Java 7 is now required. Java 8 will be required sometime soon.
Single-jar version, autoplot.jar, can be run without network access and from the command line.
Bugfixes (2015-11-24 r18066):
- das2stream supports yFormat property
- annotations now visible in pngwalks and with the server.
- qds formatter also handles BIN_MINUS and BIN_PLUS
- corrections to autorange hints
- annotation bounds were not set properly for pngwalks and with the servlet.
- formatDataSet to CDF on Windows with Webstart failed because of move, so we fall back to copy.
- rte 1586184923: user exceptions were confusing because RTE dialog showed
- try/finally block used with web communication to get mime type.
- 1486: minor corrections to layout tab to improve usability
- corrections to Dashup tool caused by minus sign vs negation in Jython AST.
- "and" and "or" must be implemented as inline operators in Dashup tool
- introduce rank0 transform methods to support Jython rank 1 iterator returns rank 0 datasets instead of doubles, breaking Juno/Waves planning script.
- rfe 457: add hidden plot would intercept mouse events, making the connected plots difficult to work with.
- rfe 464: update the initial colors.txt template so that it is not confusing.
Older Bugfixes:
- progress monitor cleaned up when aggregation is used as events list in events list tool.
- webstart jar files resigned with this year's signature
- external script editor save detect failed on Windows, this is fixed.
- 1482: vaps with two time-series-browse datasets, each listening to plot.context property
- pngwalks with images without timeaxes would incorrectly use xaxis ranges instead of filename
- arrow is included in the annotation bounds.
- finally name dark green and purple color.
- huge scatter uses 1-pixel connecting line when zoomed in closely.
- 1479: format then parse in time range event firing could cause very deep stacks.
- 1480: old bug where change in component (|slice) wouldn't properly lock the application is fixed.
- add TailBundleDataSet, which allows bundle(alpha,red,green,blue) to work with rank 2 datasets.
- rte_0553700540: index out of bounds exception when "|log10" was missing parens, this is allowed now.
- rte_2066281934: catch IndexOutOfBoundsException when trying to parse "...+...+...", now throws parse exception.
- rte_1417924229: transitional state produced NullPointerException
- 1478: slice and unbundle operations properly preserve units, eq and ne operators improve support for nominal data.
- PNG support corrects problems with alpha channel when reading and formatting PNG files.
- TimeParser $(subsec) had a bug with rounding.
- 1473: create pngwalk by orbit without rescale fails
- 1472: HTTPFileSystem fails to query for username after typo
- 1470: de-internationalize the three codes that were accidentally internationalized.
- 1468: Chris pointed out the setting for the default browser in the settings, which pointed out that Java handles this now, since Java6.
- 1465: check before closing an editor with changes.
- invokeScriptSoon dialog would leave progress monitor hanging if there's a exception thrown in the script..
- remove extra question mark when reporting data was exported.
- corrections to hrinterval and time format, correctly using the stop time and supporting end modifier.
- clean up address bar as vap is loaded.
- "2014-001 to 2015-001 UTC" is supported now.
Features:
- 466: copy-n-paste plots.
- script editor allows entry into data source editors with right-click→actions→"inspect URI"
- ISO8601 parser now supports time zone offsets.
- Clean-up and logging of OpenDap code so more predicatable failures can be studied.
- nc4 extension is recognized as NetCDF.
Less recent features:
- crosshair digitizer supports meta-C copy, putting the X,Y,Z values into the paste buffer.
- crosshair digitizer reports R,G,B values for images.
- hugeScatter zooms in to one-pixel width connector, when connector is used
- StackedHistogram mode added to support Voyager and ISEE datasets from U. Iowa Plasma Wave Group
- Color dialog allows colors to be sampled from other applications on the screen.
- inline jython editor has syntax highliting and completions.
- purple-yellow colorbar added. Thanks, Chris!
- style editor for digital renderer added, controls are now formatted to vap file.
- contour plot is finally added to list of plot types.
- AUTOPLOT_DATA/config/colors.txt allows new colors to be added to palette.
- add experimental caching of intermediate results in process string.
- introduce histogram2d process
- dashup removeValues introduced. Finish off the original list of functions.
- 313: remember dialog size and positions
- plot visible property no longer hides the data renderers.
- axes and plots now have fontSize property, which works like the annotation fontSize property, so '2em' is twice the canvas font height.
- putValues method added to support Dashup and also to match putProperty method.
- rfe456: jython editor detects external changes
- dashup can be enabled with environment variable "enableDashup=true" in config/system.properties.
- rfe453: axis tab has timerange editor for when the timerange isn't an axis.
- rfe454: support arbitrary rank data with HDF5 plugin.
- pngwalk allows &timerange= in URI to constrain the image timeranges.
- 451: keep track of running script so buffer doesn't swap
- 345: first go at annotations
- improvements to $(enum) in timeranges, providing code to read out the enumerated values.
Known issues:
This completes the feature set for the new production branch. No major features will be added before branching this version.
A production branch will be started in a couple of weeks, and the "Start Autoplot" link at the top of
autoplot.org will run this version.
Feedback on the function and quality of this release is greatly appreciated!
Data is input from:
- ASCII files (.dat,.txt)
- CSV files (.csv)
- Binary files (.bin)
- CDF files(.cdf)
- Excel spread sheets (.xls)
- das2Streams (.d2s or .das2Stream)
- ViRBO's TSDS server
- CDAWeb data server (vap+cdaweb:)
- das2servers (vap+das2server:)
- QStreams (.qds), QDataSet on a das2Stream
- Plasma Wave Group das2 Server
- NetCDF files (.nc,.ncml)
- HDF5 files (.h5,.hdf5)
- DODs servers (.dds)
- Cluster Exchange Format files (.cef)
- Fits Format Files
- Images (.jpg, .png, .gif)
- Wav audio files (.wav)
This is not complete, and limitations include:
- Quantities of rank 3 dimensionality (e.g. flux(Time,Energy,pitch) are plotted by slicing.
- Quantities of rank 4 dimensionality (e.g. flux(Time,Energy,azimuth,sector) are plotted by slicing twice.
autoplot.org is the wiki website, and contains
more information than this launch page.