Autoplot Application (20150828a)

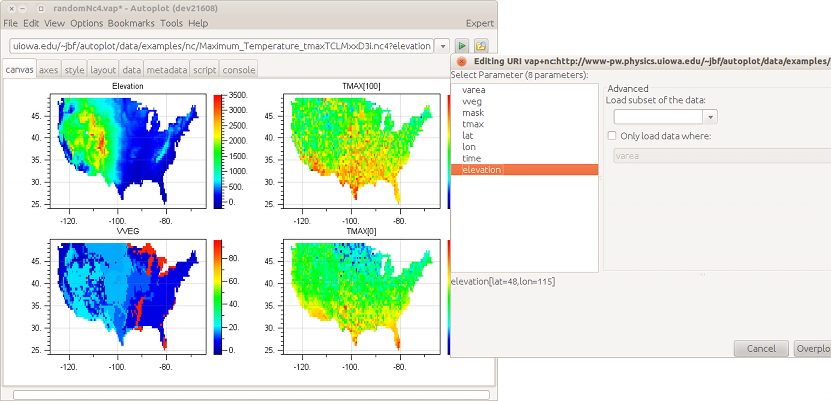
Random NC4 used to verify new HDF5 dialog.
Autoplot attempts to allow plotting of data from many data sources, including local files and OpenDAP servers.
Datasets are identified with URIs, and by the URI's extension a module is used to load the data into the internal data model. Data is then
displayed by guessing the rendering method and axis ranges to provide a reasonable, useful view of the data.
This is the Autoplot2015a branch. This is an update to the production version containing bugfixes and minor new features.
Java 7 is now required. Java 8 will be required sometime soon.
Single-jar version, autoplot.jar, can be run without network access and from the command line.
Bugfixes (2015-08-27 r17320l):
- screenshots tool includes Windows as well as Frames when masking for privacy.
- 1453: AggregatingDataSource now uses the time constraint when identifying the delegate file for retrieving metadata, avoiding extraneous load.
- 1448: allow capitalized extentions like ".PNG" when explicit filenames are used.
- 1433: double check on timetags was too restrictive and throwing out too much data from RBSP waveform data, George pointed out.
- Ephemeris ticks now use resolution when tick labels are sourced from TimeSeriesBrowse.
- PNGWalk "View in Autoplot" button will look at PNG metadata to extract the timerange.
- More zaxis properties are loaded in das2streams.
- 1165: create pngwalk uses user prefs for grid and other options.
- xls files would drop the last record.
- xls files would have times shifted by local time zone.
- bugfix: null pointer when no color was selected in pick colors dialog on Linux.
- rank 3 data in QStream wasn't properly read in.
- Autoplot dialogs like the "additional operators" don't have goofy default question mark icons.
- output of contour hard to use, breaks in non-monotonic data. Thanks Sebastian!
- rte 2091983907: thread safety in pngwalk. Thanks usuario!
- rte_1604359977: limit the total number of filePollUpdates threads that can be started to 10000. Thanks, Bob!
- completions within a function call are corrected. plot( ripples<C> ) corrected.
- 1439: add "delete selected items" to edit menu of DataPointRecorder
- bugfix: Sebastian demonstrated that QStream with DEPEND_0 having DEPEND_0 would cause failure.
- bugfix: Sebastian demonstrated that embed data failed when the URI was ''.
- bugfix: Kristoff demonstrated that embed data doesn't work when the file came via http.
- 1442-6: camelCase for the plotx command.
- 1442-7 symbolSize instead of symSize
- 1442-10: height and width boxes on mac
- resizeForCanvasSize didn't consider that the canvas may already be disconnected from the application
- 1433: Kristoff pointed out that when records contain fill or are not long enough for the interval, then the ytags would be left with a different length.
- bugfixes with rich ascii.
- 1088: clip off the extra stuff when we do completions in the middle of a parameter.
- tolerate mixed case DISPLAY_TYPE metadata in CDF files.
- 1434: metadata propagation through operators is inconsistent, inconvenient
- 1433: allow waveform cadence to change in fftPower.
- 1432: list of list to declare double arrays (and rank 2 datasets) in Jython.
- 1431: "Cannot create PyString from null" popup in editor.
- Ops.labels renamed to Ops.labelsDataset, to avoid name clashes.
- completions within command, like plotx(<C>) where we need to look up the documentation for plotx.
- more support for color argument in plotx
- plot and plotx command are finally one and the same.
- check for null in setSymbolConnector, setColor, setFillColor.
- cdfn and cdfj loggers combined to "cdf" since there's just one cdf source.
- bug where cdf editor had no visible variables because of bugs with CDF editor (Thanks Mark and Matt).
- bug where labels were array [N] instead of [1,N] corrected.
- ds[rank0ds] handled in Jython
- flattenRank2 handles rank 1 DEPEND_1.
- correction where FFT window was applied twice corrected.
- qds supports BIN_PLUS and BIN_MINUS properties, WEIGHTS.
- verify the qstream packet length is less than 1000000, to aid in debugging.
- warning icon persists, where it was cleared mistakenly before.
- scriptContext formatDataSet allows progress monitor.
- imports are allowed with server port again.
- updates to many of the example scripts.
- bugfixes in block from 2015-07-15 to 2015-07-26
- FFTPower would apply the window twice, affecting the data. Thanks, Chris!
Older Bugfixes:
- minor tweaks to property editor
- update RBSP orbits to 2827
- hide the "filters" name which is meaningless to the scientists, and use "operations" (which is just as meaningless, but there's one fewer name).
- check to see that the bookmarks are loaded before assuming they had been, to support running scripts within 10 seconds of launch.
- total of total showed a bug where the weights were not properly accounted for.
- 1422: filters GUI would run filters on the event thread, hanging app for slow filters.
- old code for managing the tick formatter assumed that milliseconds would be sufficient.
- CollapseFilterEditor panel would loose the selected index when resetting the dimension names.
- add progress monitor to InlineDataSource
- das2server GUIs would drop intrinsic and item keywords.
- add missing sqrt and pow filters to FilterChain GUI.
- vap+inline: supports more complex URIs that contain getDataSet calls with ampersands within.
- ds1 + '5nT' will preserve the DEPEND_0 of ds1.
- SpectrogramRenderer would incorrectly guess the limit when NN rebinning was used, after new code was added earlier this Spring.
- USER_PROPERTIES copied over for Juno das2stream in odd branch.
- filters tool keeps alpha list and tree list synchronized to the same selection.
- 1347: finally make the result from reducex have uniform timetags.
- next/prev buttons check log property so that we avoid RTE with negative numbers.
- rte_2038937185: handle case where WWWAuthenticate is not provided by HTTP server.
- use "alphabetical" where "alpha" was used before. Brevity didn't help and could confuse.
- format to CDF with append multiple sets of timetags.
- Vertical slice on two-record spectrogram can now access the first record.
- 1415: plotting one day of data from a yearly aggregation. The exact URI timerange now appears.
- 1414: previous scan button needs to check for log property
- slices have properly hidden next/previous buttons
- 1408: make sure .vap file name is in address bar after loading.
- move getCompletions and sleep over from the application context to data source context. Thanks, Simon!
- 1408: put the script arguments on the address bar and in history. Thanks, George!
- label for atan2 function was acos, left over from cut-n-paste code. Thanks, Dave!
- rte_0484501685: don't allow format to XLS when the dataset is more than 65000 records, because it will crash. Thanks, Mary!
- rte_1830226672: check for valid name in reject method. Thanks acho!
- 1409: subsetting with new CDF library fails, with rank 1 DEPEND_1.
- rte_1765707187: export to file when filename is relative is allowed now. Thanks Ananya!
- rte_0874741227: nullPointerException with Jython scripts, thanks Bill and Dan!
- setDepend0Cadence supports rank 3 joins
Features:
- 441: allow $v and $x to trigger the split index.
- Introduce "flaky server" code to model slow servers so Autoplot can deal with them more effectively.
- 1448: explicit control of output filenames in pngwalk.
- where keyword support in HDF5
- HDF5 now has an editor panel.
- improvements to completions in Jython editor panel.
- plot named parameters have consistent capitalization and index named parameter introduced.
- embed data found in data sources that does not have a URI ("vap+internal:")
- opposite property for axes.
- support $x/$Y_$m for file storage models
- rfe 439: Need standard method for getting a second Autoplot app in a script.
- avoid filesystem completions with inline, cdaweb, or pdsppi.
- completions are working somewhat with vap+inline.
- within parameter added to CDF
- plotx command legendLabel named parameter added.
- plotx linestyle added.
- improvements to DashupTool.
- update the port reported when the server is on, to support automatic selection of port with --server=0.
- support Units.RGBColor for the units of the colorBy dataset.
Less recent features:
- improvements to feedback in CDF parameter editor panel.
- 1425: implicit events file format allows any text file with ISO8601, ISO8601 for the first two columns to be implicitly treated as an events file.
- add rank 4 ones and replicate functions.
- 1421: filters can now be cancelled.
- add fft and magnitude to the filters.
- intrinsic checkbox in das2server editor panel. Bold font used to improve readability.
- compile in new Dashup GUI for testing.
- in Jython, add datumRange method for coercing various object types into DatumRange.
- allow vap+jyds:http://... when the whitelist contains just http://...
- system property AUTOPLOT_DATA can be used to specify autoplot_data folder location.
- GUI title indicates if problematic 32bit Java is used.
- layout tab has add plots and delete plots button.
Known issues:
This completes the feature set for the new production branch. No major features will be added before branching this version.
A production branch will be started in a couple of weeks, and the "Start Autoplot" link at the top of
autoplot.org will run this version.
Feedback on the function and quality of this release is greatly appreciated!
Data is input from:
- ASCII files (.dat,.txt)
- CSV files (.csv)
- Binary files (.bin)
- CDF files(.cdf)
- Excel spread sheets (.xls)
- das2Streams (.d2s or .das2Stream)
- ViRBO's TSDS server
- CDAWeb data server (vap+cdaweb:)
- das2servers (vap+das2server:)
- QStreams (.qds), QDataSet on a das2Stream
- Plasma Wave Group das2 Server
- NetCDF files (.nc,.ncml)
- HDF5 files (.h5,.hdf5)
- DODs servers (.dds)
- Cluster Exchange Format files (.cef)
- Fits Format Files
- Images (.jpg, .png, .gif)
- Wav audio files (.wav)
This is not complete, and limitations include:
- Quantities of rank 3 dimensionality (e.g. flux(Time,Energy,pitch) are plotted by slicing.
- Quantities of rank 4 dimensionality (e.g. flux(Time,Energy,azimuth,sector) are plotted by slicing twice.
autoplot.org is the wiki website, and contains
more information than this launch page.