Autoplot Application (20150418a)

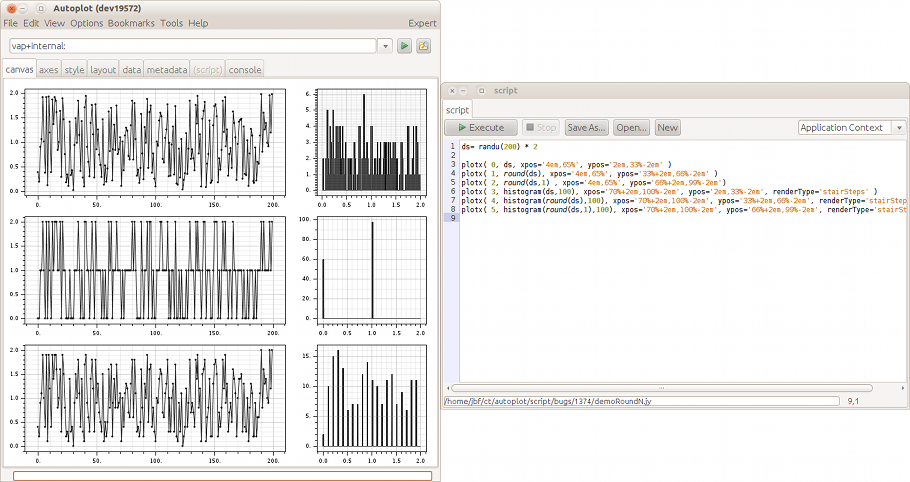
Round-to-n places from python is replicated.
Autoplot attempts to allow plotting of data from many data sources, including local files and OpenDAP servers.
Datasets are identified with URIs, and by the URI's extension a module is used to load the data into the internal data model. Data is then
displayed by guessing the rendering method and axis ranges to provide a reasonable, useful view of the data.
This is the Autoplot2015a branch. This is an update to the production version containing bugfixes and minor new features.
Java 6 is now required. Java 7 will be required in May!
Single-jar version, autoplot.jar, can be run without network access and from the command line.
Bugfixes (2015-04-18 r16704):
- remove long operations from the droplist of recent operations. They mess up the layout of the GUI, and are probably difficult to interpret anyway.
- add round(n,1) to match Python round function.
- allow single-letter variable name lookups.
- OpenDAP support would collapse rank 3 and rank 4 data, because early version of Autoplot only supported rank 2 data.
- switch to latest version of Java CDF library
- Autoplot server only accepts connections from localhost, and doesn't allow imports.
- correct branch where names were used instead of labels for x,y,z plots from das2server.
- kludge in update to force repaint when valid range and fill value fields are changed.
- rte_1630095413: clean up transition by clearing input and filter. Before the wrong dataset was sent to the filter.
- 1366 DasProgressPanel constructor should be protected. Jython scripts would sometimes not have a showing progress bar
- aggregation of two QStreams would fail because of change to when join datasets are flattened.
- 1362: memory leaks shown by Kenzie's FFT process.
- 1359: scan buttons get into funky state demonstration
- clarify smax<smin message in eventsRenderer
- bugfix when very small times were used and seconds was 0. with parse and format times.
- correct where $(subseconds,places=6) was ignoring the frational part of the seconds field, and was just using the micros.
- 1359: trim() supports waveform dataset, which was causing scan to next to fail.
- unsigned bytes, shorts and ints in HDF5 files are corrected.
- minor performance enhancements for huge scatter renderer
- 1357: avoid nasty messages about immutable datasets, where CDAWeb plugin was modifying data that will soon be immutable.
- 1356: clean up code where the listener would add another listener.
- 1355: old renderer would paint new dataset, which could hang the event thread
- 1353: corrections to huge scatter where large waveform packets were preventing it from painting individual points.
- 1354: edit style properties now brings up custom editor.
- bugfix: single-tag dataset for ephemeris would result in RTE.
- HtmlTableDataSource name changes, improved support for dates.
- huge scatter properly implements flipped
- magic number check on CDF files would fail with old CDF files
- IndexGenDataSet is now final, more operations try to preserve internal types to save memory.
- CDF file units can now contain LaTeX code as well.
- 1350: Corrections to QStreams containing bundles.
- rte 2071287514: cancel dialog by closing window caused RTE. Check for other places where it is assumed at least one element is returned. Thanks Bob!
Older Bugfixes:
- divp implementation fixed
- modp correctly supports seconds-since units to provide easy method for getting hours since midnight.
- don't show number of Epoch records when variable record count doesn't match
- Improve feedback when NetCDF file is mistaken for CDF file
- RGBRenderer checks for log/linear match and prints a warning when they don't match
- within function would incorrectly perform where command, when result should have been zeros and non-zeros. This will affect scripts that use this command.
- clean up javadoc for ArrayDataSet. Make ArrayDataSet implementations consistent with one another.
- introduce org.virbo.dataset.examples.Schemes.java, so that javadoc can refer to it.
- PWD was not available when --script was used.
- 1341: CDF subsample was terribly slow, because subsampling/5M record file. Now just read in all the data, then subsample. Thanks Kristoff!
- pngwalk generation would fail when years were 2008-2014, because it was counting off in 365-day, not yearly increments.
- add Ops.datum after seeing that dataset('2011-06-08T01:54') would parse but datum('2011-06-08T01:54') would not.
- 1339: LANL rank 4 cdf file shows that DataSetWrapper rank 4 was never implemented. Thanks Brian!
- createPngWalk code used to assume vap argument was local reference, which needn't be the case. This may cause problems on Windows.
- set the initial timerange to avoid extraneous load. Thanks Reiner!
- initially set it to slices0(:) GUI correctly.
- 1334: first image of pngwalk would be loaded at the full resolution.
Features:
- add more shortcuts to jython editor, and screen showing shortcuts.
- applot.py matured and improves support for SciPy.
- Autoplot Server port only listens to localhost, and does not allow imports.
- update RBSP orbits to 2015-05-01
- finish off applot.py support for Autoplot in native SciPy applications, using Autoplot server.
- export to CDF supports UINT1, UINT2, and UINT4 data types.
- add more examples to InlineDataSource editor panel, to add colored events bar.
- add PutPropertyFilterEditorPanel, which allows valid ranges and missing metadata to be specified
- introduce DatumRangeUtil.parseDatumRange(String) which detects ISO8601 times or units equal to UTC.
- automatic hang detection writes RTE to autoplot_data/log/ when app hangs for 10 seconds.
- added BindingSupport.printStatus() to help find memory leaks caused by bindings
- get rid of extraneous InterruptedExceptions which were thrown from the bowels, and needn't be propagated to the more abstract waitUntilIdle
- renderer style panels for Contour, PitchAngleDistribution, and EventsBar styles.
- more dasCore code cleanup
Less recent features:
- Ascii Table data URIs now support arg_0 to match CDF, which automatically gets the ISO8601 column 0 dependence.
- putBundleProperty and putIndexedProperty added to make it easier to build bundles.
- random sequences used for randn can now be reset.
- support rank 2 bundle in export to IDLSAV
- CDF reader detects HDF and NetCDF files with .cdf extension
- add origin and clockwise controls to pitch angle distribution renderer
- 406: CDF files support some LaTeX for MMS labels
- format to idlsav supports bundles
- javadoc improvements throughout dasCore and QDataSet packages
- DataSetBuilder add nextRecord( Object ... values ) to provide efficient way to define bundles in scripts
-
- 415: plotx(xpos='50%,100%-5em',ypos='20%,50%') allows direct specification of layout.
- ticks can be set manually from scripts.
- console GUI can export records as XML or flat ascii file now
- Autoplot servlet supports backgroundColor=none for transparent backgrounds
- pngwalk create speed is reported in images per minute instead of .1/sec
- add fftPower that matches the filter call.
- javadoc improvements to DasCore
Known issues:
This completes the feature set for the new production branch. No major features will be added before branching this version.
A production branch will be started in a couple of weeks, and the "Start Autoplot" link at the top of
autoplot.org will run this version.
Feedback on the function and quality of this release is greatly appreciated!
Data is input from:
- ASCII files (.dat,.txt)
- CSV files (.csv)
- Binary files (.bin)
- CDF files(.cdf)
- Excel spread sheets (.xls)
- das2Streams (.d2s or .das2Stream)
- ViRBO's TSDS server
- CDAWeb data server (vap+cdaweb:)
- das2servers (vap+das2server:)
- QStreams (.qds), QDataSet on a das2Stream
- Plasma Wave Group das2 Server
- NetCDF files (.nc,.ncml)
- HDF5 files (.h5,.hdf5)
- DODs servers (.dds)
- Cluster Exchange Format files (.cef)
- Fits Format Files
- Images (.jpg, .png, .gif)
- Wav audio files (.wav)
This is not complete, and limitations include:
- Quantities of rank 3 dimensionality (e.g. flux(Time,Energy,pitch) are plotted by slicing.
- Quantities of rank 4 dimensionality (e.g. flux(Time,Energy,azimuth,sector) are plotted by slicing twice.
autoplot.org is the wiki website, and contains
more information than this launch page.