Autoplot Application (20141009a)

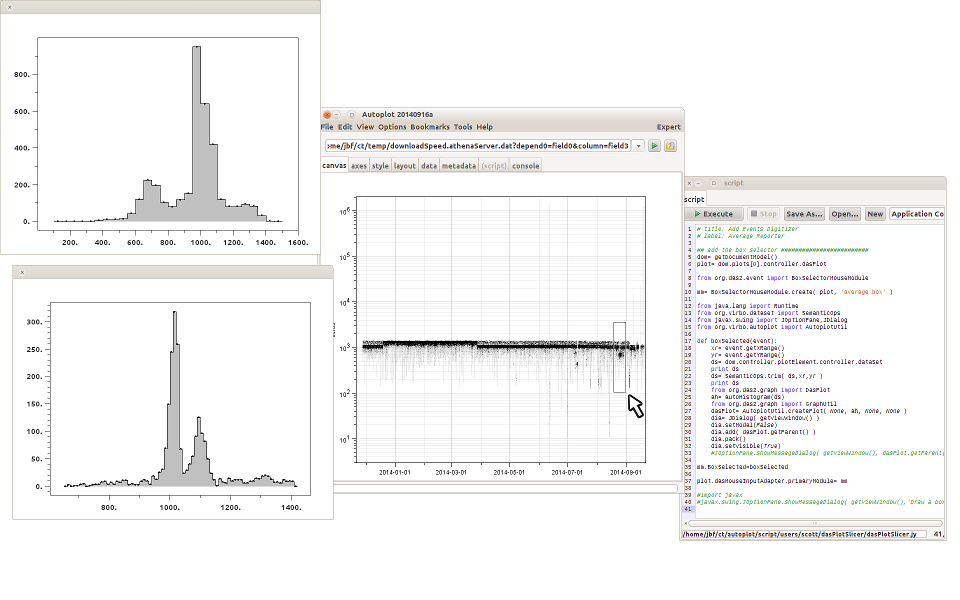
Interactive slicer written in Jython shows the histogram of the points within the box.
Autoplot attempts to allow plotting of data from many data sources, including local files and OpenDAP servers.
Datasets are identified with URIs, and by the URI's extension a module is used to load the data into the internal data model. Data is then
displayed by guessing the rendering method and axis ranges to provide a reasonable, useful view of the data.
This is the Autoplot2014a branch. This is an update to the production version containing bugfixes and minor new features.
Java 6 is now required.
Single-jar version, autoplot.jar, can be run without network access and from the command line. Note CDFs are only supported
via the Java-based reader and Autoplot will attempt to use it when the C-based version is not available.
SourceForge has changed the numbering of all the bugs. If you go to the page
https://sourceforge.net/p/autoplot/bugs/, "Search Bugs" in the upper left corner can be used
to resolve old numbers.
Bugfixes (2014-10-09):
- catch missing rank and name tags in QStreams
- 1272: (rte 1771804608) new users would see failure to check for null pointers when creating folders. Thanks CORYB and lesidaner!
- 1265: Don't reload remote scripts into the editor when the local copy is already showing. Show fscache scripts as read-only.
- Hanning window had off-by-one error making it asymmetric
- 1270: improve labels for Tools bookmarks. Improve handling of .jy for tools
- 1270: Beware: any tool in the Tools bookmarks is trusted, including remote bookmarks!
- formatBookmarks formats to temp file then moves result
- asterisk in new folder of bookmarks tool fixed.
- 1229: Apache HTTP automatic unzip/gzip. Improvements to get this working.
Older Bugfixes:
- 1266: Jython script editor recent files GUI font increased to 10 to improve legibility.
- trim dataset would fail when trim boundary was after the biggest point
- completions in jython accept the java code with correct arguments now, was taking the last one.
- 1264: changes to support updates as the user drags the mouse
- 1263: old kludge for LANL prevented Maven cdf from working, tighten up kludge to only use if necessary.
- 1259: reload all needs to reload the ephemeris (TCA) data.
- 1250: Ephemeris (TCAs) from TSBs at the mission beginning and NRT handled poorly.
Features:
- 393: das2server list responses can contain human-readable descriptions.
- --server keyword replaces --port keyword, indicate server status on title bar.
- add randu functions, since Matlab "rand" is ambiguous.
- introduce merge command for safely combining datasets
- improvements to the orbit plot, including properly binding color and thick.
- Tools bookmarks editor rebranded "Tools", avoid problem where address bar is reset to the script name.
- introduce save_cdf and restore_cdf intended to replace save and restore commands in IDL with non-proprietary format.
- jython editor shows python doc blocks in popup completions.
- secret button for switching dataSetSelector/timeRangeSelector
- improve gap detection in orbitPlot
- orbitPlot supports renderControls like color and lineThick.
- 391: aggregation trims datasets so that result is monotonic
Less recent features:
- Internal RBSP Orbits updated to 2014-10-09
- 385: tools menu now supports folders
- generalize mean, mode, stddev, and variance to support any rank dataset by using DataSetIterator. Support fill data.
- rfe 387: support gzip encoding in downloadResourceAsTempFile.
- rfe 386: interpolation routines must only extrapolate modestly.
- CDF filtering Rank 2 variables with other Rank 2 variables
- createPlot resurrected to support slicers
Known issues:
This completes the feature set for the new production branch. No major features will be added before branching this version.
A production branch will be started in a couple of weeks, and the "Start Autoplot" link at the top of
autoplot.org will run this version.
Feedback on the function and quality of this release is greatly appreciated!
Data is input from:
- ASCII files (.dat,.txt)
- CSV files (.csv)
- Binary files (.bin)
- CDF files(.cdf)
- Excel spread sheets (.xls)
- das2Streams (.d2s or .das2Stream)
- ViRBO's TSDS server
- CDAWeb data server (vap+cdaweb:)
- das2servers (vap+das2server:)
- QStreams (.qds), QDataSet on a das2Stream
- Plasma Wave Group das2 Server
- NetCDF files (.nc,.ncml)
- HDF5 files (.h5,.hdf5)
- DODs servers (.dds)
- Cluster Exchange Format files (.cef)
- Fits Format Files
- Images (.jpg, .png, .gif)
- Wav audio files (.wav)
This is not complete, and limitations include:
- Quantities of rank 3 dimensionality (e.g. flux(Time,Energy,pitch) are plotted by slicing.
- Quantities of rank 4 dimensionality (e.g. flux(Time,Energy,azimuth,sector) are plotted by slicing twice.
autoplot.org is the wiki website, and contains
more information than this launch page.