Autoplot Application (20140925b)

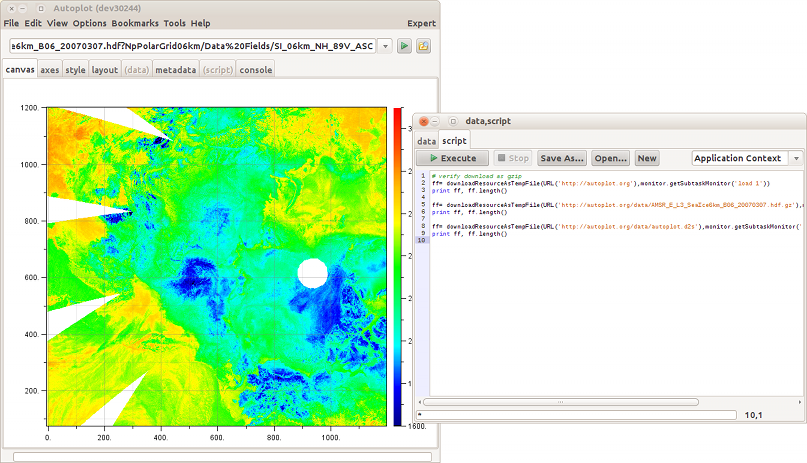
HDF file is downloaded with downloadResourceAsTempFile, which will use gzip compression if it's available.
Autoplot attempts to allow plotting of data from many data sources, including local files and OpenDAP servers.
Datasets are identified with URIs, and by the URI's extension a module is used to load the data into the internal data model. Data is then
displayed by guessing the rendering method and axis ranges to provide a reasonable, useful view of the data.
This is the Autoplot2014a branch. This is an update to the production version containing bugfixes and minor new features.
Java 6 is now required.
Single-jar version, autoplot.jar, can be run without network access and from the command line. Note CDFs are only supported
via the Java-based reader and Autoplot will attempt to use it when the C-based version is not available.
SourceForge has changed the numbering of all the bugs. If you go to the page
https://sourceforge.net/p/autoplot/bugs/, "Search Bugs" in the upper left corner can be used
to resolve old numbers.
Bugfixes (2014-09-22):
- 1266: Jython script editor recent files GUI font increased to 10 to improve legibility.
- trim dataset would fail when trim boundary was after the biggest point
- completions in jython accept the java code with correct arguments now, was taking the last one.
- 1264: changes to support updates as the user drags the mouse
- 1263: old kludge for LANL prevented Maven cdf from working, tighten up kludge to only use if necessary.
- 1259: reload all needs to reload the ephemeris (TCA) data.
- 1250: Ephemeris (TCAs) from TSBs at the mission beginning and NRT handled poorly.
Older Bugfixes:
- 1255: slow rendering, flash feedback can basically hang system
- das2server source uses requiresInterval parameter from dsdf to comply with Juno ephemeris sources.
- TCAs are reset in reload all data action
- 1255: slow rendering, flash feedback can basically hang system
- In autoranging, correct the logic that detects when all data bunches into first histogram bin, indicating log should be used.
- 1253: partial loads from daily TSB with pngwalk by orbit
- kludge in check for "No Data Found" from das2server
- 1254: generateTimeRanges failure found by Sebastian
- 0849786987: "Attempt to copy non-qube into ArrayDataSet" message when Bill would run into with Juno reader
- import completions file was missing, resulting in NullPointerException
- 1251: whopping bug (but somehow didn't affect anyone) in monitor management and reference caching, where finished could be called prematurely.
Features:
- Internal RBSP Orbits updated to 2014-10-09
- 385: tools menu now supports folders
- generalize mean, mode, stddev, and variance to support any rank dataset by using DataSetIterator. Support fill data.
- rfe 387: support gzip encoding in downloadResourceAsTempFile.
- rfe 386: interpolation routines must only extrapolate modestly.
- CDF filtering Rank 2 variables with other Rank 2 variables
- createPlot resurrected to support slicers
Less recent features:
- stddev and variance routines added
- import completions improved
Known issues:
This completes the feature set for the new production branch. No major features will be added before branching this version.
A production branch will be started in a couple of weeks, and the "Start Autoplot" link at the top of
autoplot.org will run this version.
Feedback on the function and quality of this release is greatly appreciated!
Data is input from:
- ASCII files (.dat,.txt)
- CSV files (.csv)
- Binary files (.bin)
- CDF files(.cdf)
- Excel spread sheets (.xls)
- das2Streams (.d2s or .das2Stream)
- ViRBO's TSDS server
- CDAWeb data server (vap+cdaweb:)
- das2servers (vap+das2server:)
- QStreams (.qds), QDataSet on a das2Stream
- Plasma Wave Group das2 Server
- NetCDF files (.nc,.ncml)
- HDF5 files (.h5,.hdf5)
- DODs servers (.dds)
- Cluster Exchange Format files (.cef)
- Fits Format Files
- Images (.jpg, .png, .gif)
- Wav audio files (.wav)
This is not complete, and limitations include:
- Quantities of rank 3 dimensionality (e.g. flux(Time,Energy,pitch) are plotted by slicing.
- Quantities of rank 4 dimensionality (e.g. flux(Time,Energy,azimuth,sector) are plotted by slicing twice.
autoplot.org is the wiki website, and contains
more information than this launch page.