Autoplot Application (20140808a)

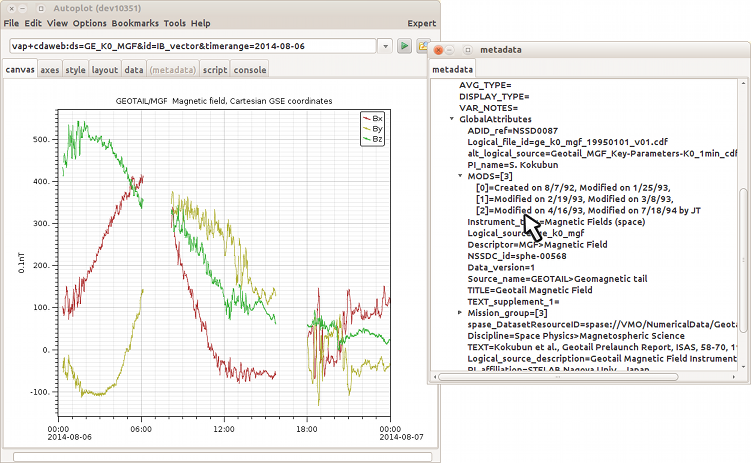
All the elements of arrays in the global attributes of a CDF files are now shown.
Autoplot attempts to allow plotting of data from many data sources, including local files and OpenDAP servers.
Datasets are identified with URIs, and by the URI's extension a module is used to load the data into the internal data model. Data is then
displayed by guessing the rendering method and axis ranges to provide a reasonable, useful view of the data.
This is the Autoplot2014a branch. This is an update to the production version containing bugfixes and minor new features.
Java 6 is now required.
Single-jar version, autoplot.jar, can be run without network access and from the command line. Note CDFs are only supported
via the Java-based reader and Autoplot will attempt to use it when the C-based version is not available.
SourceForge has changed the numbering of all the bugs. If you go to the page
https://sourceforge.net/p/autoplot/bugs/, "Search Bugs" in the upper left corner can be used
to resolve old numbers.
Bugfixes (2014-08-06):
- CDF Metadata uses arrays when there are multiple values. Thanks Ken for pointing this out.
- PDS/PPI file browsing is done off the event thread
- 421: double load of Das2Source caused by mouse-wheeling
- Kristoff pointed out where Jython GUI wouldn't reset properly when dom.plots[0].yaxis.range was used as default.
- interpolation codes preserve more metadata
- jython completions allow selection for all argument combinations, not just one.
- completions-based editor bugfix, where it would not recognize HDF5 as file-based
- append wasn't able to append two datasets that had enumerations that didn't have the same units. Now it can.
- kludge in URI formatting to use + instead of %20 in timeranges to improve ledgibility
- 1065: reduce flickering caused by unneeded setDataSet(null)
- tweaks to the jython editor panel automatic GUI.
- minor improvements to CEF including UNITS, DELTA_PLUS/DELTA_MINUS, showing data before support data.
- rank 2 data was misread in the CEF reader.
- http://autoplot.org/autoplot.jnlp?bookmarks:...bookmarks.xml now works in re-enter code.
- medianFilter had a bug where repeated values were not counted twice. Thanks Kenzie!
- spectrogram style panel comes up for PitchAngleDistribution mode now, which is slightly better than Series panel.
- don't load the file automatically into the jython editor if it is already loaded. This is dangerous and distracting.
- pitchAngleDistribution mode wouldn't get a colorbar because it wasn't installed in the canvas
- medianFilter was never put in the filters list
- jyds would use 2010-01-01 (the default timerange) incorrectly.
- check for zero-length datasets in extent function, this was preventing reduceMean from working with all-fill records.
- use SpectrogramStylePanel for pitchAngleDistribution
- export to .wav file checks for non-monotonically increasing data, after discovering das2server would repeat records.
- reduceMean checks for NaNs, and treats them as fill data to be consistent with other codes.
- 1224: TSB load when timerange is context (not x-axis), zoom in on timerange
- 1222: next/prev buttons get into funky state as if not updating
- 1226: rich headers containing a value element will not be connected to the data column by implicit name (P1).
- 1216: series renderer misconfigured for large datasets rendering.
- 1217: Spectrogram rebinner reverts after change and TSB reload.
- 1215: occasional blips in SeriesRenderer http://www.sarahandjeremy.net:8080/hudson/job/autoplot-test140/lastSuccessfulBuild/artifact/diffs.test141_file__home_jbf_ct_autoplot_vap_bugs_pw_generalPathBlips_generalPathBlips.vap.png
- ds=<C> completions in PDSPPI source.
- rte_1282463981: guard against data that was mismarked as monotonic in ArrayDataSet
Older Bugfixes:
- minor bug in local file cache browser fixed
- vapfile:http://server.gov/vapserver?data0=... works now
- formatDataSet command accepts arguments like "foo.xls?sheet=Sheet1"
- more bugfixes to support v1.08 vap files (auto renderstyle)
- setStatus would often push extra event on to event queue.
- clean up for drag and drop URIs to make things work on Mac and Windows.
- 1210: http user agent was not indicated in web server logs.
- 1209: nextprev scan thread can spin in endless loop
- 1208: occasional hang that seems to be associated with TimSort bug
- 1205: aggregate all breaks with jyds script with timerange param
- File->print is performed off the event thread because this can be slow or even hang on Linux.
- 421: double load of Das2Source caused by misformatted URI
- "getting started" dialog had unused browseLocal branch that was broken
- bug in slicing would loose TCA metadata from das2server in d2s, loosing fill value.
- dataVisible and layoutVisible flags were not set properly new window, so these tabs were not properly initialized.
- isNotFile corrected to match "file:/home..." as a file in automatic completions-based editor.
- rte_0829456451: file:/home/... instead of file:///home/... would result in null pointer exception with completions-based GUI. Thanks Chris!
- bug 1195: Akebono MCA data script shows memory leaks. Thanks Takahiro!
- trim out indented blocks in removeSideEffects
- check for invalid URLs in Das2DataSource editor panel.
- aggregate one (just the address bar) no longer resets the range
- vap+orbit: URIs work with Automatic data source editor GUI.
- append( FDataSet, DDataSet ) would fail
- support $x in timeformat parameter of ascii parser.
- null pointer exception in logging because of misuse of logger.log( level, template, parms )
- fix occasional index-out-of-bounds seen when scripting by making defensive copy of application state.
- rte_1786254278: disable the pngwalk navigate menu when there is no sequence loaded. Thanks mariahelgacosentino!
- das2Stream "no data found" exception handled properly
- current das2server is set on the event thread after Chris showed where sloppy code would occasionally fail.
- newer Axis scan/step code could get stuck in a infinite loop when invalid bounds were returned (Cindy's data showed this)
- ascii table editor wasn't resizing with the GUI.
- EFW produced a CDF file with no depend 0, this should work instead of RTE.
- boolean properties failed in completions because of "isProp" instead of "getProp"
- set unit increment on filters list scroll bar on Filters panel.
Features:
- File->Add Plot From... list is sorted by last use.
- AutoplotServer images are set to .vap file height and width by default
- Make PNGWalk allows writing to PDF files instead of .PNG files.
- PDSPPI supports discovery (File->Add Plot From...->PDSPPI)
- RBSP orbits updated to 2014-08-13.
- minor kludge in URI format/parse to use + in timerange parameters instead of %20, so the URIs are more legible.
- 370: getParam dom for defaults. Datum and DatumRange now allowed as parameters. URI uses DataSetSelector.
- http web filesystem avoids listing when the filename is known already, supporting use with Github.
- introduce median and mean filters, thanks Kenzie!
- OpenDAP looks for missing_value and title metadata, preparing to update demo 1 bookmark.
- CDAWeb vap servlet improves error feedback
- PDSPPI source allows completions based on the names in the VOTables
- read description and valid min and valid max from VOTables.
- add butterworth to the filters
Less recent features:
- export to xls allows append and more ordinal data
- experimental secret clean cache feature introduced.
- 351: save previous entries to jython getParam forms. Allow address bar trigger to contain parameter settings.
- add weights to output of rebinBundle.
- improve feedback while scanning local cache.
- add allow embed in vap file dialog. This works well enough.
- jython "show usages" action added
- jython script can be run from any Autoplot window, ask if switch context.
- move lookupUnits to Units class from SemanticOps, introduce lookupDatum to make standard spot for this logic
- das2streams allow the monitor taskSize to be set in a comment.
- put in filesystem completions when the method is "File" constructor
- rfe 361: give the user the option of resetting the main window when a script is run from a second window.
- rfe 337: Reset timerange when using URIs from bookmarks and recent history
- add code to get the PID to aid in debugging with JVisualVM
- keep track of reason why filesystem is offline.
- add option to disable scan (instead of step), which can cause problems with batch processing
- add monitor use to example codes in Jython editor.
- when zoomX is selected, mouse wheel will also only zoom in X.
- make it less likely to select a long, narrow box, which messes up ranges.
- rfe 363: improvements to completions in the editor.
- rfe 364: propogate timetags through findex and interpolate.
- support rank 2 DEPEND_1 in CDF export
- allow "file:" prefix in writeToPng
- add insert new plot above
- add break into stack of plots
- Ctrl-F is bound to Fix-Layout feature
- writeToPng allows "file:///tmp/png/foo.png" because it's easy to assume "file:" would be okay (Takahiro)
- add showYPosition(false) to the connector between two plots (Kristoff).
- 363: improvements to completions in Jython editor, including JOptionPane.s<C>
- About Autoplot dialog shows build server location.
Known issues:
This completes the feature set for the new production branch. No major features will be added before branching this version.
A production branch will be started in a couple of weeks, and the "Start Autoplot" link at the top of
autoplot.org will run this version.
Feedback on the function and quality of this release is greatly appreciated!
Data is input from:
- ASCII files (.dat,.txt)
- CSV files (.csv)
- Binary files (.bin)
- CDF files(.cdf)
- Excel spread sheets (.xls)
- das2Streams (.d2s or .das2Stream)
- ViRBO's TSDS server
- CDAWeb data server (vap+cdaweb:)
- das2servers (vap+das2server:)
- QStreams (.qds), QDataSet on a das2Stream
- Plasma Wave Group das2 Server
- NetCDF files (.nc,.ncml)
- HDF5 files (.h5,.hdf5)
- DODs servers (.dds)
- Cluster Exchange Format files (.cef)
- Fits Format Files
- Images (.jpg, .png, .gif)
- Wav audio files (.wav)
This is not complete, and limitations include:
- Quantities of rank 3 dimensionality (e.g. flux(Time,Energy,pitch) are plotted by slicing.
- Quantities of rank 4 dimensionality (e.g. flux(Time,Energy,azimuth,sector) are plotted by slicing twice.
autoplot.org is the wiki website, and contains
more information than this launch page.