Autoplot Application (20140214b)

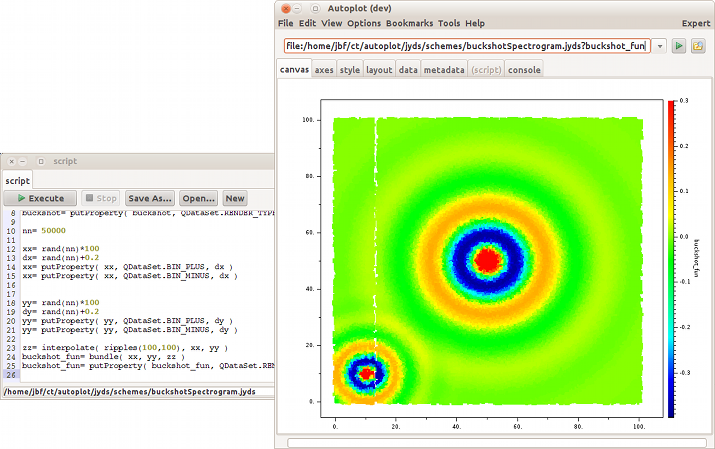
Improve support for rendering (X,Y,Z) buckshot data with spectrograms.
Autoplot attempts to allow plotting of data from many data sources, including local files and OpenDAP servers.
Datasets are identified with URIs, and by the URI's extension a module is used to load the data into the internal data model. Data is then
displayed by guessing the rendering method and axis ranges to provide a reasonable, useful view of the data.
This is the Autoplot2013b branch. This is an update to the production version containing bugfixes and minor new features.
Java 6 is now required.
Single-jar version, autoplot.jar, can be run without network access and from the command line. Note CDFs are only supported
via the Java-based reader and Autoplot will attempt to use it when the C-based version is not available.
SourceForge has changed the numbering of all the bugs. If you go to the page
https://sourceforge.net/p/autoplot/bugs/, "Search Bugs" in the upper left corner can be used
to resolve old numbers.
Bugfixes (2014-02-14):
- DE CDF data had rank 0 DELTA_PLUS. This is supported now.
- Non-time strings got into the time range dialog, causing parse errors.
- update version in about dialog
- new code that sorts das2server folders and files would drop nodes. (Thanks Chris!)
- the vap files don't save the displayTitle property (Thanks Chris!)
- 1157: allow renders to specify if they have autoranged a dimension.
-
- file chooser in the resourceURI dialog didn't set the current directory properly.
Older Bugfixes:
- four-argument-histogram routine now takes datums and strings as arguments.
- jython (a,b)=myFunc() now supports a,b in selection.
- tab completion on the address bar works again with JythonDataSource.
- 1156: Scott's script shows that color scatter was broken in December
- timeSeriesBrowse resulted in timerange being added to scripts in jyds editor when it wasn't needed
- das2server delays loading icons. The way it was coded would block GUI until they were loaded
- Autoranging handles where lots of zeros are found in differences, which would cause problems
- 1137: back off recent changes after seeing it mucked up Jemmy tests (and interactive use by clients) with demo 5 (stack of series).
- Red squiggle used to indicate errors in the Jython editor, the old block offered no feedback when highliting.
- scripts are loaded off the event thread
- Jython data source editor would not handle RESOURCE_URI correctly.
- 1148: reference cache finally gets immutability right, by making dataset immutable before it enters the cache.
- 1145: just don't offer $Y$m01 as a completion. This was put in to support CDAWEB, and direct CDAWEB support lessens the need for this
- remove RANGE_CHECK because it would cause RTE when it's legitimate to query zero-length qube datasets for other dimensions
- automatic completions editor works for URIs that don't have a file, like vap+orbit:
- Application-Name and Codebase to manifest to get rid of warning messages.
- documentation popup on script editor works again.
- SortDataSet called with zero-length sort list is trivially okay.
Features:
- introduce support for ordinal data in CDFs
- another round of findbugs
- remove use of obsolete classes like DasDie.
- another round of findbugs (down to 98 from 250+)
- improve support for buckshot data in spectrogram rebinners
- formatDataSet back to ScriptContext in new attempts to clean up security.
Less recent features:
- drag a box to select multiple plots on layout panel
- drag on layout panel is shortcut for swap
- axis flipped property is supported in the vaps.
- Allow smooth on rank 2 datasets, smoothing on the first dimension (usually time).
- internal rbsp orbits updated to 2014-02-03
- das2server lists folders separately from data sources.
- All CDF Global metadata now appears under "GlobalAttributes" node in metadata tab.
Known issues:
This completes the feature set for the new production branch. No major features will be added before branching this version.
A production branch will be started in a couple of weeks, and the "Start Autoplot" link at the top of
autoplot.org will run this version.
Feedback on the function and quality of this release is greatly appreciated!
Data is input from:
- ASCII files (.dat,.txt)
- CSV files (.csv)
- Binary files (.bin)
- CDF files(.cdf)
- Excel spread sheets (.xls)
- das2Streams (.d2s or .das2Stream)
- ViRBO's TSDS server
- CDAWeb data server (vap+cdaweb:)
- das2servers (vap+das2server:)
- QStreams (.qds), QDataSet on a das2Stream
- Plasma Wave Group das2 Server
- NetCDF files (.nc,.ncml)
- HDF5 files (.h5,.hdf5)
- DODs servers (.dds)
- Cluster Exchange Format files (.cef)
- Fits Format Files
- Images (.jpg, .png, .gif)
- Wav audio files (.wav)
This is not complete, and limitations include:
- Quantities of rank 3 dimensionality (e.g. flux(Time,Energy,pitch) are plotted by slicing.
- Quantities of rank 4 dimensionality (e.g. flux(Time,Energy,azimuth,sector) are plotted by slicing twice.
autoplot.org is the wiki website, and contains
more information than this launch page.