Autoplot Application (20130915a)

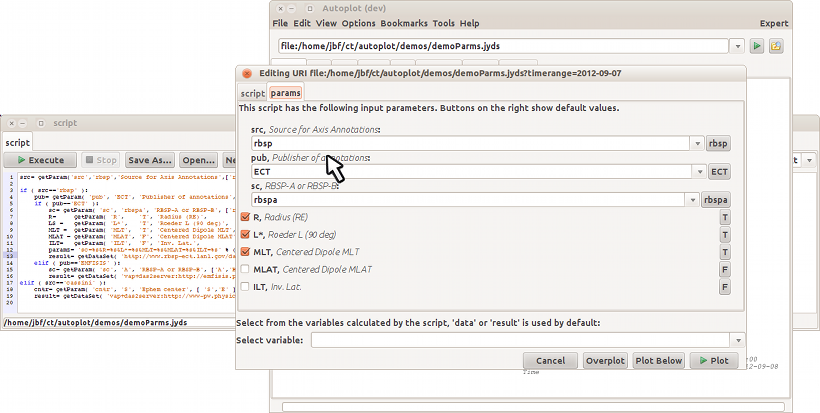
The parsing of scripts to produce a GUI is more sophistocated now, allowing for branches with different get parameter calls.
Autoplot attempts to allow plotting of data from many data sources, including local files and OpenDAP servers.
Datasets are identified with URIs, and by the URI's extension a module is used to load the data into the internal data model. Data is then
displayed by guessing the rendering method and axis ranges to provide a reasonable, useful view of the data.
This is the Autoplot2013a branch. This is an update to the production version containing bugfixes and minor new features.
Java 6 is now required.
Single-jar version, autoplot.jar, can be run without network access and from the command line. Note CDFs are only supported
via the Java-based reader and Autoplot will attempt to use it when the C-based version is not available.
Bugfixes:
SourceForge has changed the numbering of all the bugs. If you go to the page
https://sourceforge.net/p/autoplot/bugs/, "Search Bugs" in the upper left corner can be used
to resolve old numbers.
- massive findbugs cleanup to get below 300 flags
- rte_0750582163: throw NoDataInInterval exception so that is easier to understand that the parser was not properly configured.
- plotx properly supports renderType='contour>levels=0.1&color=blue'
- vap+cdaweb:ds=RBSPA_EFW-L2_VSVY-HIRES&id=vsvy_vavg correctly reads units as the single-file readers do.
- rte_0851835013: data point recorder forces .dat or .txt extensions
- rte_1906877305: okay press on select datasource without selection
- plotx(1,uri) didn't respect TimeSeriesBrowse
- script: is only allowed from first window, second window prints a warning.
- autorange for many renderers didn't look for log setting, forcing result to be linear when the dataset defaults wanted log
- rte_0369904082: orbit numbers when at the end of the known orbits
- ContextFlowView when image is smaller than 400 pixels in width.
- rfe 314: bugfixes to scriptServlet, which was broken since jython import
- 1102: feedback problems with slicers, rank 2 DEPEND_1
- 1101: trim with CDFs with rank 2 DEPEND_1.
- java-based CDF library would incorrectly handle 1-element dimensions
- next/prev buttons disabled in PngWalkTool when there is no pngwalk loaded
- rte_2025985649: NullPointerException with search and replace in the python editor
- 1096: NOAA GOES 13 mag data can be read
- 1095: Aggregating data source with avail=T didn't use the ReferenceCache properly.
- CDFFile data source IO Errors could mess up the reference cache, making some URIs hang.
- 314: finally handle brackets in cdf filenames, Windows temporary files
- itext pdf output ignores canvas font
- 1094: uninstallRenderer needed for EventsRenderer lookup
- 1091: cancel check of subTask not handled properly
- 1088: completions RTE with doDep=
- Jython completions cancel when enter is pressed
- various minor bugs that showed during RBSP meeting
- PDFs use embedded fonts
- Clean up the cdaweb exceptions that were never fixed after data was moved around
- Seth's CDF which had fill in Y that would cause problems.
- options for PDF output allow user to substitute curves for fonts
- 1087: rank2 CDF DEPEND_1 reduce improvements
- 1086: strange timeranges show up with time series browse
- 1085: cancel in aggregation doesn't cancel properly, messing up cache
- stderr noise about Find-next.png from jsyntaxpane looking for incorrect file
- "submit" button on error dialog is default
- rich ascii export of vector and spectrogram datasets works, moreso
Older Bugfixes:
- 1083: garbled tools list when adding tool
- 1082: opacity in aggregation
- 1079: tearoff tabbed pane does a better job with labels for the windows.
- 1081: eventListColumn was broken from v2013a_8 through v2013a_9
- tearoff tabbed pane does a better job with labels for the windows.
- eventListColumn was broken from v2013a_8 through v2013a_9
- use the URI timerange. Before it would be used briefly, then reset as soon as the data is loaded.
- 1077: first plotElement has resetPlotElement true after syncTo
- lanl can't get jython files from autoplot.org, so just get them from the java path
- don't quantize orbit datum ranges. When quantizing, use much finer quanta.
- drop target containing file URIs works on a mac and other platforms
- bugfix where one-dataset bundle wouldn't plot as Y(T)
- 1076: width=0 causes runtime error dialog.
- 1075: changesSupport needs to keep a count
- 1074: lockup because of loose thread safety
Features:
- rfe 322: Bookmarks for the Axis Annotations
- rfe 320: Jython automatic gui based on Jython Syntax tree, allowing more sophistocated scripts
- export to wave table clips to visible range, not wave packet boundaries
- blurURI in TimeSeriesBrowse introduced, which will be used to clean up multiple timerange references in a vap.
- PNGWalk tool has a link to start up or make visible an Autoplot window
- rfe 316: completions should be in a scrollable list
- message bubbles are no longer printed in PDFs and PNGs
- Mouse modules announce themselves and indicate escape-to-cancel
- Taller/Shorter buttons on layout panel, shift works on layout panel to select range
- scary exception when no native CDF library removed
- more TimeRangeTool buttons
- improvements to jython completions include def names and assignments
- 314: support "import autoplotapp as app", cleaning up jython. Legacy scripts are still supported.
Less recent features:
- first experiments with slice0 at datum, like |slice0('2013-07-12T18:00')t
- dataset('2013-07-12T18:00') handles times and datum ranges now.
- recent history GUI allows wildcards, like rbsp*.vap
- ascii plugin supports units and dep0units.
- tweaks to rich pngs, which have metadata that allows digitizing
- add replicate(ds,len)
Known issues:
This completes the feature set for the new production branch. No major features will be added before branching this version.
A production branch will be started in a couple of weeks, and the "Start Autoplot" link at the top of
autoplot.org will run this version.
Feedback on the function and quality of this release is greatly appreciated!
Data is input from:
- ASCII files (.dat,.txt)
- CSV files (.csv)
- Binary files (.bin)
- CDF files(.cdf)
- Excel spread sheets (.xls)
- das2Streams (.d2s or .das2Stream)
- ViRBO's TSDS server
- CDAWeb data server (vap+cdaweb:)
- das2servers (vap+das2server:)
- QStreams (.qds), QDataSet on a das2Stream
- Plasma Wave Group das2 Server
- NetCDF files (.nc,.ncml)
- HDF5 files (.h5,.hdf5)
- DODs servers (.dds)
- Cluster Exchange Format files (.cef)
- Fits Format Files
- Images (.jpg, .png, .gif)
- Wav audio files (.wav)
This is not complete, and limitations include:
- Quantities of rank 3 dimensionality (e.g. flux(Time,Energy,pitch) are plotted by slicing.
- Quantities of rank 4 dimensionality (e.g. flux(Time,Energy,azimuth,sector) are plotted by slicing twice.
autoplot.org is the wiki website, and contains
more information than this launch page.