Autoplot Application (20130328a)

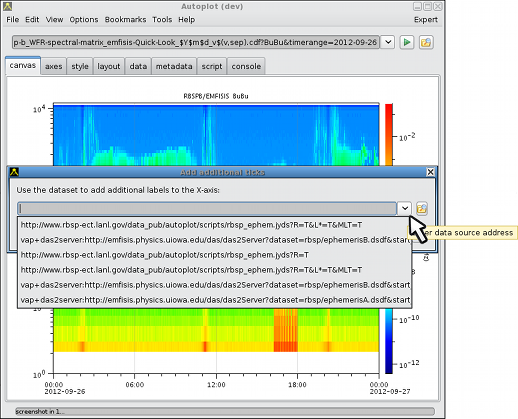
Add ticks from dialog now keeps its own history.
Autoplot attempts to allow plotting of data from many data sources, including local files and OpenDAP servers.
Datasets are identified with URIs, and by the URI's extension a module is used to load the data into the internal data model. Data is then
displayed by guessing the rendering method and axis ranges to provide a reasonable, useful view of the data.
This is the Autoplot2012b branch. This is an update to the production version containing bugfixes and minor new features.
Java 6 is now required.
Single-jar version, autoplot.jar, can be run without network access and from the command line. Note CDFs are only supported
via the Java-based reader and Autoplot will attempt to use it when the C-based version is not available.
Bugfixes:
- fix problem where save vap before load vap would leave Craig in a strange folder
- Leonard pointed out case where CAA would return CDFs that didn't properly mark fill and would cause RTE.
- Reiner had RTE caused by URL having "user@" inserted automatically when authorization was needed
- Bugfix when output of rank 2 where was used to index dataset.
- Non-ascii check in ascii parser didn't account for tabs (ascii=9)
- trace function restored when developing jython scripts.
- downloadResourceAsTempFile cleanup policy changed to support multiple processes and Tomcat servers
- history dialog takes timezone into account when listing today, yesterday, etc
- recent change broke BUNDLE in rank 3 datasets from CDF file.
- sprocess was called twice when exporting the processed data.
- 3608830: disable export options that won't work.
- rte_1825469520: URL doesn't contain authority (http:///autoplot.org/)
- recent history takes current timezone into account when listing today and yesterday's URIs
- v2013b_23 had a bug that broke slice1 keyword for C-based reader
- status bar at the bottom no longer truncates.
- autohistogram/autoranging would fail sometimes with log, picking linear instead.
- Larry pointed out that "|hanning(1024)|fftPower(1024)" was briefly broken.
- run script dialog would sometimes hang on Windows 7. This is fixed by starting the dialog on the event thread.
- 3607777: dialogs should be resizable. FilterChainPanel would clip okay button on small displays.
- Ascii parser can now handle files with three ISO8601 timetags
- Provide a more precise error message when a reference to a plugin is found but plugin is not available.
- bugfix: test025 showed where Bx**2 was dropping depend_0 after recent changes.
- 3606898: completions based on local listings are always displayed along FS completions
- reset FS memory caches off of the event thread.
- JythonDataSource checks for CancelledOperationException, which shouldn't produce popup.
- 3607312: improve feedback when ds[0,:] is used on rank 1 dataset
- progress monitors and long warning messages were not erased properly for short plots.
- minor logging cleaning
- small findbugs cleanup
- bugfix: annotations for error wouldn't clear when editing
- AutoplotDataServer would truncate datasets when an exception was encountered.
- wave[DEP0[sec]]*window[] now preserves DEPEND_0
- fftPower function now normalizes for window
- getFrequencyDomainTags now handles case for FFT of RBSP Mag data where Hz is a better unit than KHz.
- rte0014594906: bad format code "v" in completion
- preserve log setting when overplotting a linear on log axis when linear data could fit on log
- Old versions of Java webstart (1.6u16) would fail to start because of mediawiki improperly reporting fail status.
- minor cleanup of PNGWalk tool, add new default bookmarks
- turn on tooltips for bookmarks, showing location.
- 3605590: Java CDF reader no longer holds on to open files, this caused problems, and now we close after 10 seconds.
- 3606197: NN spectrograms fixed for rank 2 DEPEND_1.
- recent changes to Jython eq and ne infix ops broke Jython code like (ds!=None)
Older Bugfixes:
- 3605224: major ticks don't line up when one axis of stack has labels.
- 3605415: CDF type "spectrogram>noauto", and user pref for spectrogram
- 3605230: jython rank zero result of gt ought to be a boolean
- 3604997: color scatter not connected to colorbar
- 3604985: CDF DELTA_PLUS/DELTA_MINUS define bins for NN Spectrogram
- 3604265: partial load of timeseries when scanning around.
- 3599689: agg sometimes not loading when two on same plot
- 3604489: double check of isLocal in WebFileSystem results in failure
- 3603701: Preserve DatumRange types (orbit:...) with built-in axis scan,history
- 3604777: agg completions missing when tab is pressed in address bar
- 3587261: white-trace-on-white background is allowed again, because trace on top of spectrogram. A warning is displayed now.
Features:
- QStream now has int8 transfer type to support CDF_TT2000 timetags.
- Additional ticks from... dialog keeps a separate history.
- Introduction of SparseDataSet, backed by a map and used to easily describe bundles.
- finally, ~ can be used in the address bar to refer to one's home folder
- export data disabled options are not valid.
- TITLE property is propogated through fftPower
- interpolate binXinterpY introduced.
- checkQube introduced to detect when datasets are really QUBEs and some opperations apply.
- Jython invokeLater command introduced to support simple concurrent scripts.
- new three-argument |fftPower(512,2,'Hanning') function allows slide and window selection.
- add "copy to clipboard" popup menu item to pngwalk tool, so users can easily copy an image to an email.
- allow autoplot.emailrte=T in properties to allow emailing RTE from networks that don't allow POST
- request processor thread limit is upped to 8 from 6, which was a kludgy fix.
- ascii parser has new format spec, e.g. format='f8,i2,i2,i2'
- add controls for label and title in ASCII URIs.
- record source of scripts installed in tools menu.
- sliceRebinnedData is now persistent between sessions, and is off by default.
- add experimental rebinner for LANL RBSP data that indicates spectrogram boundaries
Less recent features:
- experimental tool for recording GUI sequences added
- add vapfile: prefix so that I can read in exception reports without changing file names
- version stamp finally added to the address bar
- Only useful Plot Styles are enabled
- 3596086: CDF vector components selectable
- add libraries for sending email, to be used in scripts
- add button for creating time range strings in Create Pngwalk dialog
- 3598216: File cache can be organized by alpha as well as by size.
- RFE 3600323: AutoplotDataServer handles TSBs that do not product time series data
- local ro_cache.txt can now contain files that are not in the public http, to support data providers
- undo list and getLongUndoDescription now consider timerange bindings when reporting changes.
- AutoplotServlet now reports host that served the data in response header, to support clusters of servers
- Add skip parameter to csv file reader to support MyTracks app.
- Rows are plottable in the Excel spreadsheet reader.
- GPS metadata retrieved in (JPG) image viewer
Known issues:
This completes the feature set for the new production branch. No major features will be added before branching this version.
A production branch will be started in a couple of weeks, and the "Start Autoplot" link at the top of
autoplot.org will run this version.
Feedback on the function and quality of this release is greatly appreciated!
Data is input from:
- ASCII files (.dat,.txt)
- CSV files (.csv)
- Binary files (.bin)
- CDF files(.cdf)
- Excel spread sheets (.xls)
- das2Streams (.d2s or .das2Stream)
- ViRBO's TSDS server
- CDAWeb data server (vap+cdaweb:)
- das2servers (vap+das2server:)
- QStreams (.qds), QDataSet on a das2Stream
- Plasma Wave Group das2 Server
- NetCDF files (.nc,.ncml)
- HDF5 files (.h5,.hdf5)
- DODs servers (.dds)
- Cluster Exchange Format files (.cef)
- Fits Format Files
- Images (.jpg, .png, .gif)
- Wav audio files (.wav)
This is not complete, and limitations include:
- Quantities of rank 3 dimensionality (e.g. flux(Time,Energy,pitch) are plotted by slicing.
- Quantities of rank 4 dimensionality (e.g. flux(Time,Energy,azimuth,sector) are plotted by slicing twice.
autoplot.org is the wiki website, and contains
more information than this launch page.