help.mashup
From autoplot.org
Purpose: describe the mash-up tool.
Audience: scientists and interested developers
1. Using the Data Mashup Tool
In 2016 the Data Mashup Tool was introduced to Autoplot. The idea is to provide a graphical way to combine multiple datasets into new datasets without the need for a script.
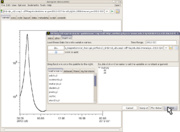
Take for example the goal of calculating the electron gyrofrequency from the B-Field magnitude. In the past, a script was needed to load the B-Field magnitude and then multiply by 28. This trivial script worked fine, but often scripts would be lost or deleted, and a new failure mode was added to the .vap file. With the Mashup tool, you would graphically construct the dataset (figure right):
Mashup is implemented as a vap+inline script, which is a tiny and limited script that fits into a URI. The script loads data from multiple URIs into given variable names, synchronizes data to one set of timetags, and then combines the data into a result.
1.1. Using for the first time
- plot http://emfisis.physics.uiowa.edu/Flight/RBSP-A/L3/$Y/$m/$d/rbsp-a_magnetometer_4sec-gei_emfisis-L3_$Y$m$d_v$(v,sep).cdf?Magnitude&timerange=2012-320
- Tools->"Mash Data..."
- The existing URI should be available at the top of the GUI. Note that the droplist can select other datasets.
- Select the mathematics tab, and drag "multiply(x,y)" onto the palette to the right. (On a Mac, select "multiply(x,y)" and then right-click (context click) on the palette.)
- Dropping a function onto a function in the palette will replace the function, and put the function into the "my functions" tab.
- double click on the "x" argument, and select ds1 (or whatever name has been given to it).
- double click on the "y" argument, and enter the literal "28"
- Hit the "plot" button.
Here is a step-by-step tutorial with pictures: http://autoplot.org/data/tutorials/20180123_mashup/mashIntro.pdf
and a video: https://www.youtube.com/watch?v=RkcYoZ8qpPw
2. Time Series Browse
Time Series Browse is the ability of a data source to create new URIs for new time ranges, and allows the scientist to browse through a long data day by day. For example, Autoplot knows that /tmp/$Y$m$d.dat?timerange=2020-02-03 is followed by /tmp/$Y$m$d.dat?timerange=2020-02-04 because Aggregation has Time Series Browse.
When one of the loaded data sets has the time series browse capability, then the mashup will also have the time series browse capability.

