Image:dataSourceEditorPanel.png
From autoplot.org
Size of this preview: 710 × 600 pixels
Full resolution (965 × 815 pixel, file size: 80 KB, MIME type: image/png)
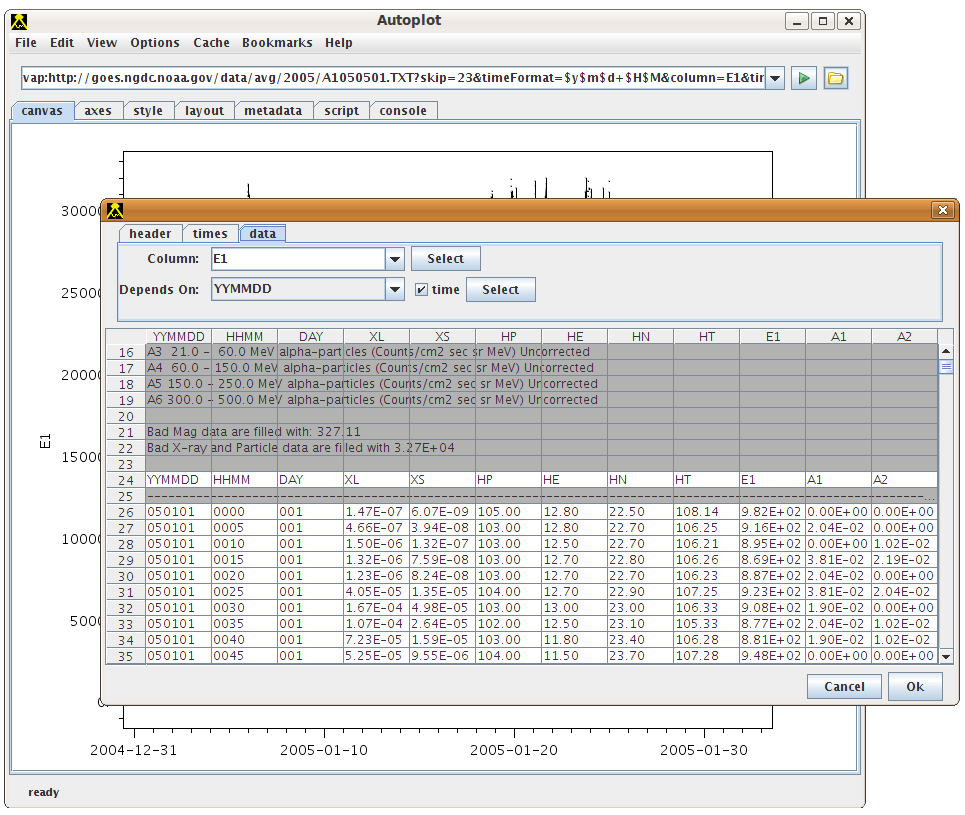
Ascii table data source editor panel configured to plot data from GOES ascii tables. The lighter rows are records that are identified as parseable. The "times" tab specifies how the first three columns to be combined to read UT times. The "header" tab specifies that 23 lines should be skipped before parsing is attempted. Note column labels are discovered in the first record at line 24, and these can be used to identify columns in the URIs. To select the parameter for plotting, use either the droplist, or press select then click on the column to plot. In the Autoplot address bar behind, you can see the URI that is formed by the editor panel.
File history
Click on a date/time to view the file as it appeared at that time.
| Date/Time | User | Dimensions | File size | Comment | |
|---|---|---|---|---|---|
| (current) | 00:52, 29 April 2009 | Jbfaden (Talk | contribs) | 965×815 | 80 KB |
- Edit this file using an external application
See the setup instructions for more information.
Links
The following pages link to this file:
