scripting
From autoplot.org
Audience: Scientists and programmers
Purpose: Introduce scripting in Autoplot, which can be used to control Autoplot, load new types of data, and create new more specialized applications.
See also developer.scripting, http://autoplot.org/data/jyds, and http://autoplot.org/data/tools/.
More scripts in the SVN repository: [1] (All scripts before and including areaSelect.py have been verified to work with current DOM).
Contents |
1. Introduction
Autoplot can be scripted using Jython. Jython is an implementation of the Python scripting language. A Jython script has easy access to Java libraries.
Scripting can be used for various purposes, including to:
- load data from multiple data sources and combine them to make a new dataset,
- automatically create a series of images, typically one image per file, called a pngwalk,
- plot complex ASCII files,
- modify the default way in which a data file is rendered, and
- create a new application.
Mathematical operations may be applied on Autoplot data objects (QDataSets) using a syntax that is similar to operations on arrays and matrices in IDL or MATLAB. Unlike arrays and matrices in IDL and MATLAB, QDataSets have metadata and physical units; the physical units must be consistent for certain operations to be carried out.
For example, this script
ds1= getDataSet( 'http://autoplot.org/data/image/Capture_00158.jpg?channel=greyscale' )
ds2= getDataSet( 'http://autoplot.org/data/image/Capture_00159.jpg?channel=greyscale' )
plot( abs( ds2- ds1 ) )
loads two grayscale images and plots the result.
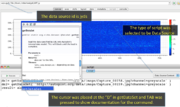
If this script is copied into the script editor (Options->Enable Feature->Script Editor) and executed, a spectrogram showing the differences between the two grayscale images is plotted.
There are two types of scripts:
- #Data Source Context: Used for loading data. These have a URI and can be used like any other data source.
- #Application Context: Used for controlling Autoplot itself.
Finally, scripts can be shared with others. For example, if a script is put on a website (http://autoplot.org/data/imageDiff.jyds), it can be run by anyone by entering the name of the script in the address bar.
2. Script Editor
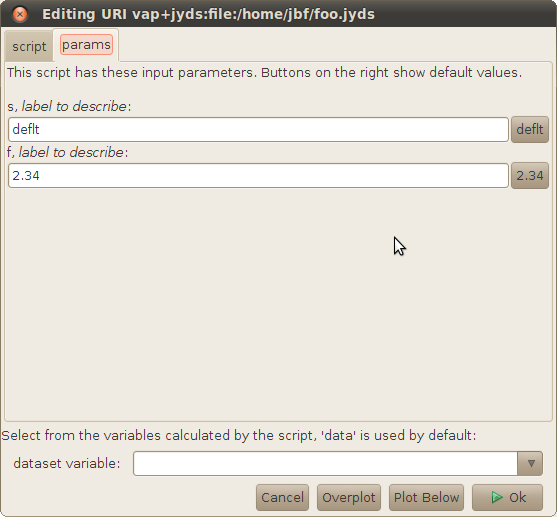
Autoplot has script editor GUI. Selecting Options->Enable Feature->Script Panel will reveal a tab named "script" where scripts may be entered and executed. When a remote script is accessed, the script editor will be used show the contents of the script for reference. Pressing "execute" will run the script (or load the data in the case of the .jyds script), and shift-execute will show a parameters dialog so that parameters can be changed interactively.
The script editor is often used with the console tab, where any messages printed will appear.
The script editor provides a simple environment where scripts can be quickly composed or inspected. Context-clicking (right mouse click or alt mouse click) will show a popup menu of available shortcuts and settings, and the editor provides simple completions for this environment. To see completions, enter TAB or ctrl-space. (Note there is a preference for disabling TAB for completion, since some may wish to use tabs in their scripts.)
3. Data Source Context
Autoplot scripts have two different contexts, which determine what a script can do. The "Data Source Context" is only for loading data, and the "Application Context" can do everything. Data Source Context scripts can be used in more applications--for example they can be used within a data server that knows nothing about the Autoplot application.
3.1. Overview
In this context, scripts load data and return a new dataset (or datasets). Data context scripts have file extension jyds (Jython data dource).
If the above script
ds1= getDataSet( 'http://autoplot.org/data/image/Capture_00158.jpg?channel=greyscale' )
ds2= getDataSet( 'http://autoplot.org/data/image/Capture_00159.jpg?channel=greyscale' )
result= abs( ds2- ds1 )
was saved and uploaded to
http://autoplot.org/data/imageDiff.jyds
then
http://autoplot.org/data/imageDiff.jyds?result
would refer to this dataset.
Data Source scripts are unaware of the Autoplot GUI and DOM; they can load and operate on data, but they cannot manipulate how the data is plotted (for example, the color of the lines may not be modified in a Data Source script). These scripts can be used outside of Autoplot for this reason, for example in custom applications that use Autoplot's data loading but not the application itself.
Commands available in this context are listed at developer.scripting#Ops. These commands will also appear in a selection menu when TAB is pressed on a blank line in the script panel.
Examples:
- In the repository: [2] .
- In cookbook#Scripting
3.2. Example: Reading ASCII file from URL
Autoplot can plot many ASCII files automatically by using either the help#ASCII_Editor or a URL template. However, many ASCII files have unusual structure and require a script to convert the data in the file into a QDataSet.
Consider this file [3], which has lines of the form
8601012082243337373350403340303 18 22 22 18 48 27 18 27 251.26  0 67.00
8601022082253740303040372720260 22 27 15 15 27 22 12  7 181.05  0 67.60
The file format specification is given at [4]. This script reads the file and convert it into a QDataSet: wdc_kp_ap.jyds
3.3. Example: Reading ASCII response URI
Consider a CGI script that returns a simply structured ASCII table
https://omniweb.gsfc.nasa.gov/cgi/nx1.cgi?activity=retrieve&res=hour&spacecraft=omni2&start_date=20180101&end_date=20180130&vars=8&vars=23
the first few lines of the response are
<HTML>
 <HEAD><TITLE>OMNIWeb Results</TITLE></HEAD>
 <BODY>
 <center><font size=5 color=red>OMNIWeb Plus Browser Results </font></center><br>
 <B>Listing for omni2 data from 20180101 to 20180130</B><hr><pre>Selected parameters:
  1 Scalar B, nT
  2 SW Proton Density, N/cm^3

 YEAR DOY HR    1     2
 2018   1  0   8.2  13.7
 2018   1  1  10.8  16.8
 2018   1  2  10.0  17.4
Because the ASCII table is simple, we would like to apply the ASCII template
time=field0&column=field4&timeFormat=$Y+$j+$H
If the URI was to a file
file:/tmp/data.txt
we could append an ASCII template to the URI into Autoplot's address bar
file:/tmp/data.txt?time=field0&column=field4&timeFormat=$Y+$j+$H
and a plot with the correct time axis would be shown.
However, because the CGI script URI has query parameters, we must use a script. Autoplot can load data from remote files, but to load data from services it must have additional code.
To plot this data, use
uri      = 'https://omniweb.gsfc.nasa.gov/cgi/nx1.cgi?'
params   = 'activity=retrieve&res=hour&spacecraft=omni2&start_date=20180101&end_date=20180130&vars=8&vars=23'
template = 'time=field0&column=field4&timeFormat=$Y+$j+$H'

file  = downloadResourceAsTempFile( URL(uri+params), monitor).toString()

data= getDataSet( 'vap+dat:'+file+"?"+template+"&allowHtml=T" )  # allowHtml is needed to prevent HTML warning (v2018a_11)

data.putProperty( QDataSet.UNITS, 'N/cm^3' )
3.4. Example: Query Parameters
Scripts can also have query parameters which allow more control of the script. The parameter names and values are passed to the script. For example, if you created a script readData.jyds with the following lines at the top
s= getParam( 's', 'deflt', 'label to describe' )   # gets a string parameter, with default value "deflt"
f= getParam( 'f', 2.34, 'label to describe' )      # gets a float parameter, with default value 2.34
The user would be able pass options to the script in the URI:
vap+jyds:file:/tmp/foo.jyds?s=abc&f=3.14159
The parameter can be type string, int, float, boolean, File, or URI. The type is determined by the default value.
3.4.1. constraints
If a fourth parameter is provided, this should be either an array of allowed values, or a dictionary. When it is a dictionary, the following can be used as tags:
- values is a list of all allowed values.
- examples is a list of values, but the scientist can specify things other than the examples.
- labels is an array which must be the same length as the enumerated values (values).
3.5. TimeSeriesBrowse
Scripts can easily support the "Time Series Browse" capability, so that scripts can be used to browse over long time series. For example, a script could read any file from vap+cdf:http://cdaweb.gsfc.nasa.gov/istp_public/data/polar/efi/$Y/po_k0_efi_$Y$m$d_v$v.cdf, and then derive data from this (http://autoplot.org/data/tsbDemo4.jyds):
# demonstrate how script can have timeSeriesBrowse to modify another dataset
timerange= getParam( 'timerange', '2000-01-09', 'timerange to plot' )
uri= 'vap+cdf:http://cdaweb.gsfc.nasa.gov/istp_public/data/polar/efi/$Y/po_k0_efi_$Y$m$d_v$v.cdf?POTENT&timerange=%s' % timerange
ds= getDataSet( uri, monitor )
if ( ds==None ):
  result= None
else:
  result= abs(ds)
  result.putProperty( QDataSet.TITLE, 'Positive Spacecraft Potential' )
This would then have URIs that have a default time range of 2000-01-09, but any timerange can be plotted by adding (for example) "?timerange=2000-01-08". Scanning on the time axis will cause the script to be called again and more data is loaded.
3.6. Monitors
Often a process takes a little while, and it would be nice to indicate to the scientist that the process is proceeding. This is done with the monitor object. See http://autoplot.org/developer.scripting#Building_Scripts .
4. Application Context
4.1. Overview
All scripting commands are available in this context. Application Context scripts modify the GUI, default canvas view, and the DOM. Application context scripts have file extension jy.
Examples:
- In the repository: [5] (All scripts before and including areaSelect.py have been verified to work with current DOM).
- In cookbook#Scripting
4.2. Example: Modify Canvas
Change line color
result= getDataSet( 'http://autoplot.org/data/autoplot.xls?column=A' )
dom.plotElements[0].style.color= Color.RED
4.3. Example: Plot all files in directory
trs= generateTimeRanges( '%Y-%m-%d', '2010-January' )
for tr in trs:
    dom.timeRange= DatumRangeUtil.parseTimeRange(tr)
    writeToPng( '/tmp/%s.png' % tr )
runs the application through each day of the month January 2010, making images of each day.
4.4. Example: Progress Monitor
All scripts may use a progress monitor to provide feedback to users. This built-in variable is named monitor .
monitor.setTaskSize(200)                     # the number of steps (arbitrary units)
monitor.started()                            # the task is started.

for i in xrange(200):
    if ( monitor.isCancelled() ): break       # if not called, the cancel button will be insensitive
    monitor.setProgressMessage('at %d' % i)   # this describes actions done to perform the task.
    monitor.setTaskProgress(i)
    java.lang.Thread.sleep(100);

monitor.finished()     # indicate the task is complete
4.5. Example: Create your own tool
Application Context scripts can be added to the Autoplot GUI by putting them in the HOME/autoplot_data/tools/ folder. http://autoplot.org/data/tools/ shows some example scripts.
Under Options->Rendering Options there is a option for showing dates as "YYYY-MM-DD" or "YYYY-DOY". This option could be made available under Tools->Toggle Day-of-Year by placing the following in HOME/autoplot_data/tools/toggleDayOfYear.jy and restarting Autoplot.
# label: Toggle Day-of-Year
val= dom.options.isDayOfYear()
val= 1-val
dom.options.setDayOfYear(val)
Note there is [menubar]->Tools->"Manage and Browse Tools" now, which lets you manage the tools just like the bookmarks. This also allows tools to reside on remote sites, and for teams to have a standard set of tools with the remote bookmarks mechanism.
5. Scripting Context
Often we want to create a specialized application for a particular science task. Invoking Autoplot with the --script option will run the script at startup. For example, you could have a digitizing application that you always want to come up in a particular configuration. The digitizer is added and the data is loaded automatically.
Invoked using the --script launch option
The name of the script (e.g. /tmp/script.jy) following the --script keyword is invoked at launch.


