help.eventsLists
From autoplot.org
Audience: scientists
Purpose: describe how events bars are drawn
1. Introduction
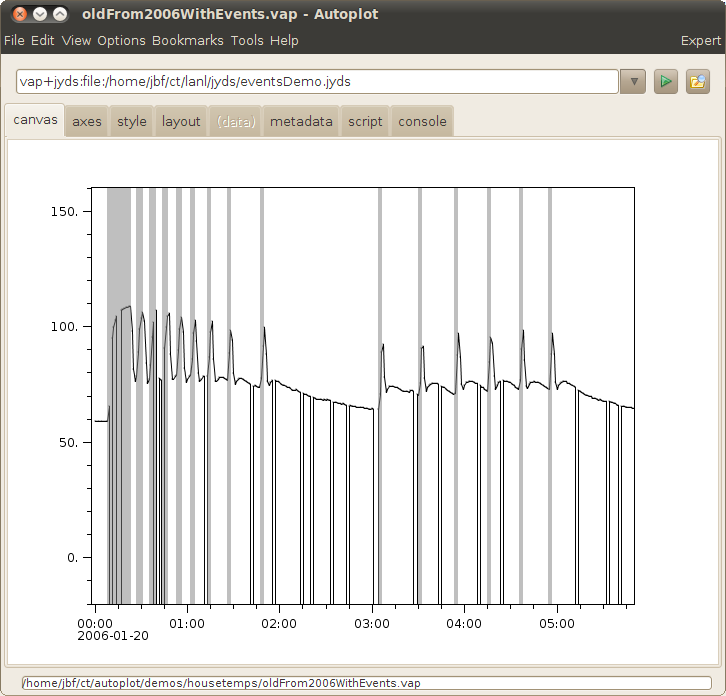
Events bars mark when events occur along a time axis. Often this is just a vertical bar at a set of times, but Autoplot also supports bars having width and color, along with annotating text.
See http://autoplot.org/wiki/index.php?title=cookbook§ion=5#Events_Bar_under_all_plots
2. In-Line Events Lists
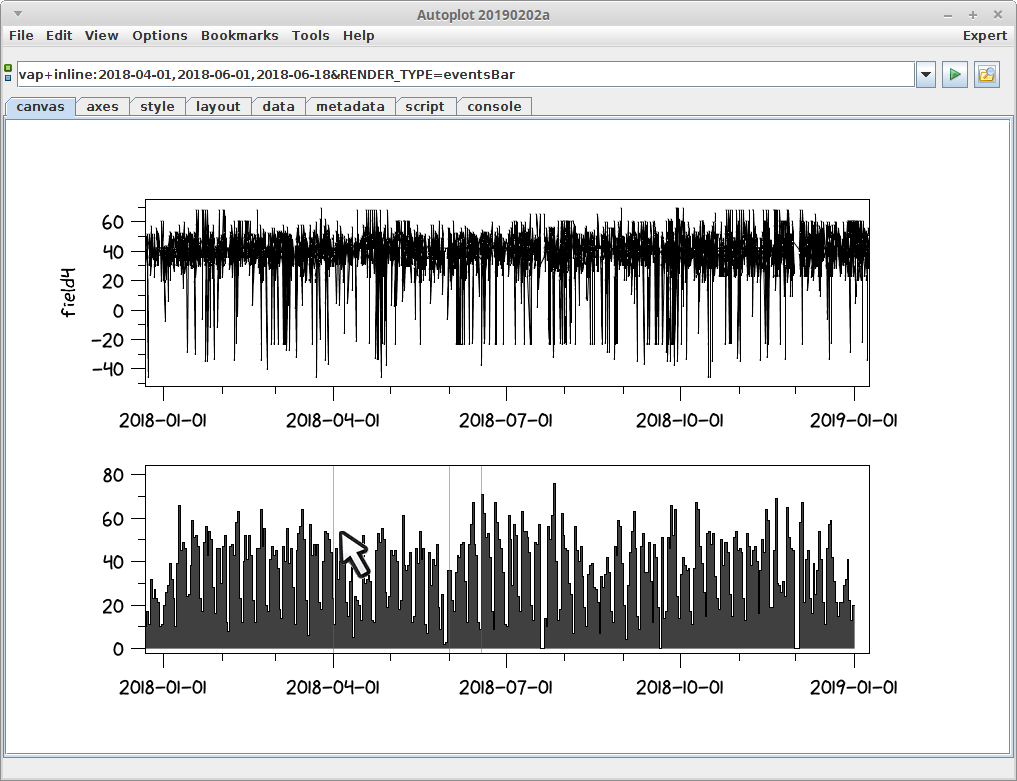
To mark just a few events, such as the start and ending boundaries, you can use inline URIs, which are URIs which contain data. For example, vap+inline:2018-04-01&RENDER_TYPE=eventsBar will be drawn as a vertical line at the time. vap+inline:2018-04-01,2018-06-01&RENDER_TYPE=eventsBar will be drawn as two vertical lines. Note the inspect icon will bring up a table for editing the events.


